Can eBPF Detect Anomalous Redis Message Patterns Before They Become Problems? [Sponsored]
Redis, an in-memory key-value store, is a popular choice for caching frequently accessed data, with companies like Twitter and GitHub using it for high throughput and low latency.
However, Redis isn’t without its challenges. Issues like memory exhaustion and CPU spikes can degrade performance and increase application response latency. This creates an inherent need for active monitoring.
In todays’ newsletter, I’ll show you how eBPF can efficiently monitor Redis deployments to identify and troubleshoot performance issues.
The Problem
Like any application component, Redis has the potential to become a bottleneck in your tech stack. Here are some common challenges developers may encounter:
Out-of-memory errors when Redis exceeds its memory limit.
Balancing the trade-off between performance and data durability.
Increased request latency affecting overall application performance.
High CPU spikes caused by complex Redis operations.
To address these issues, we first need to understand how the system operates. We achieve this by collecting observability data about Redis, like:
the variation in latency for different types of operations
how often keys are evicted due to memory constraints
the frequency and types of errors encountered.
the number of active client connections.
One way to do so is by using the metrics exported by the service itself, but this approach limits us to general observability metrics such as average read/write latency and ingress/egress bytes. For example, this approach is NOT sufficient to address issues caused by a particular complex operation that lead to performance degradation.
While we could technically utilize Redis Built-in Monitoring like the LATENCY command, we’d ideally want an active monitoring program that can decode the Redis Serialization Protocol (RESP) and provide a granular insights into each separate Redis command, making it easier to isolate and debug issues on-the-fly.
Let's see if eBPF can help us.
The Solution — eBPF Observability
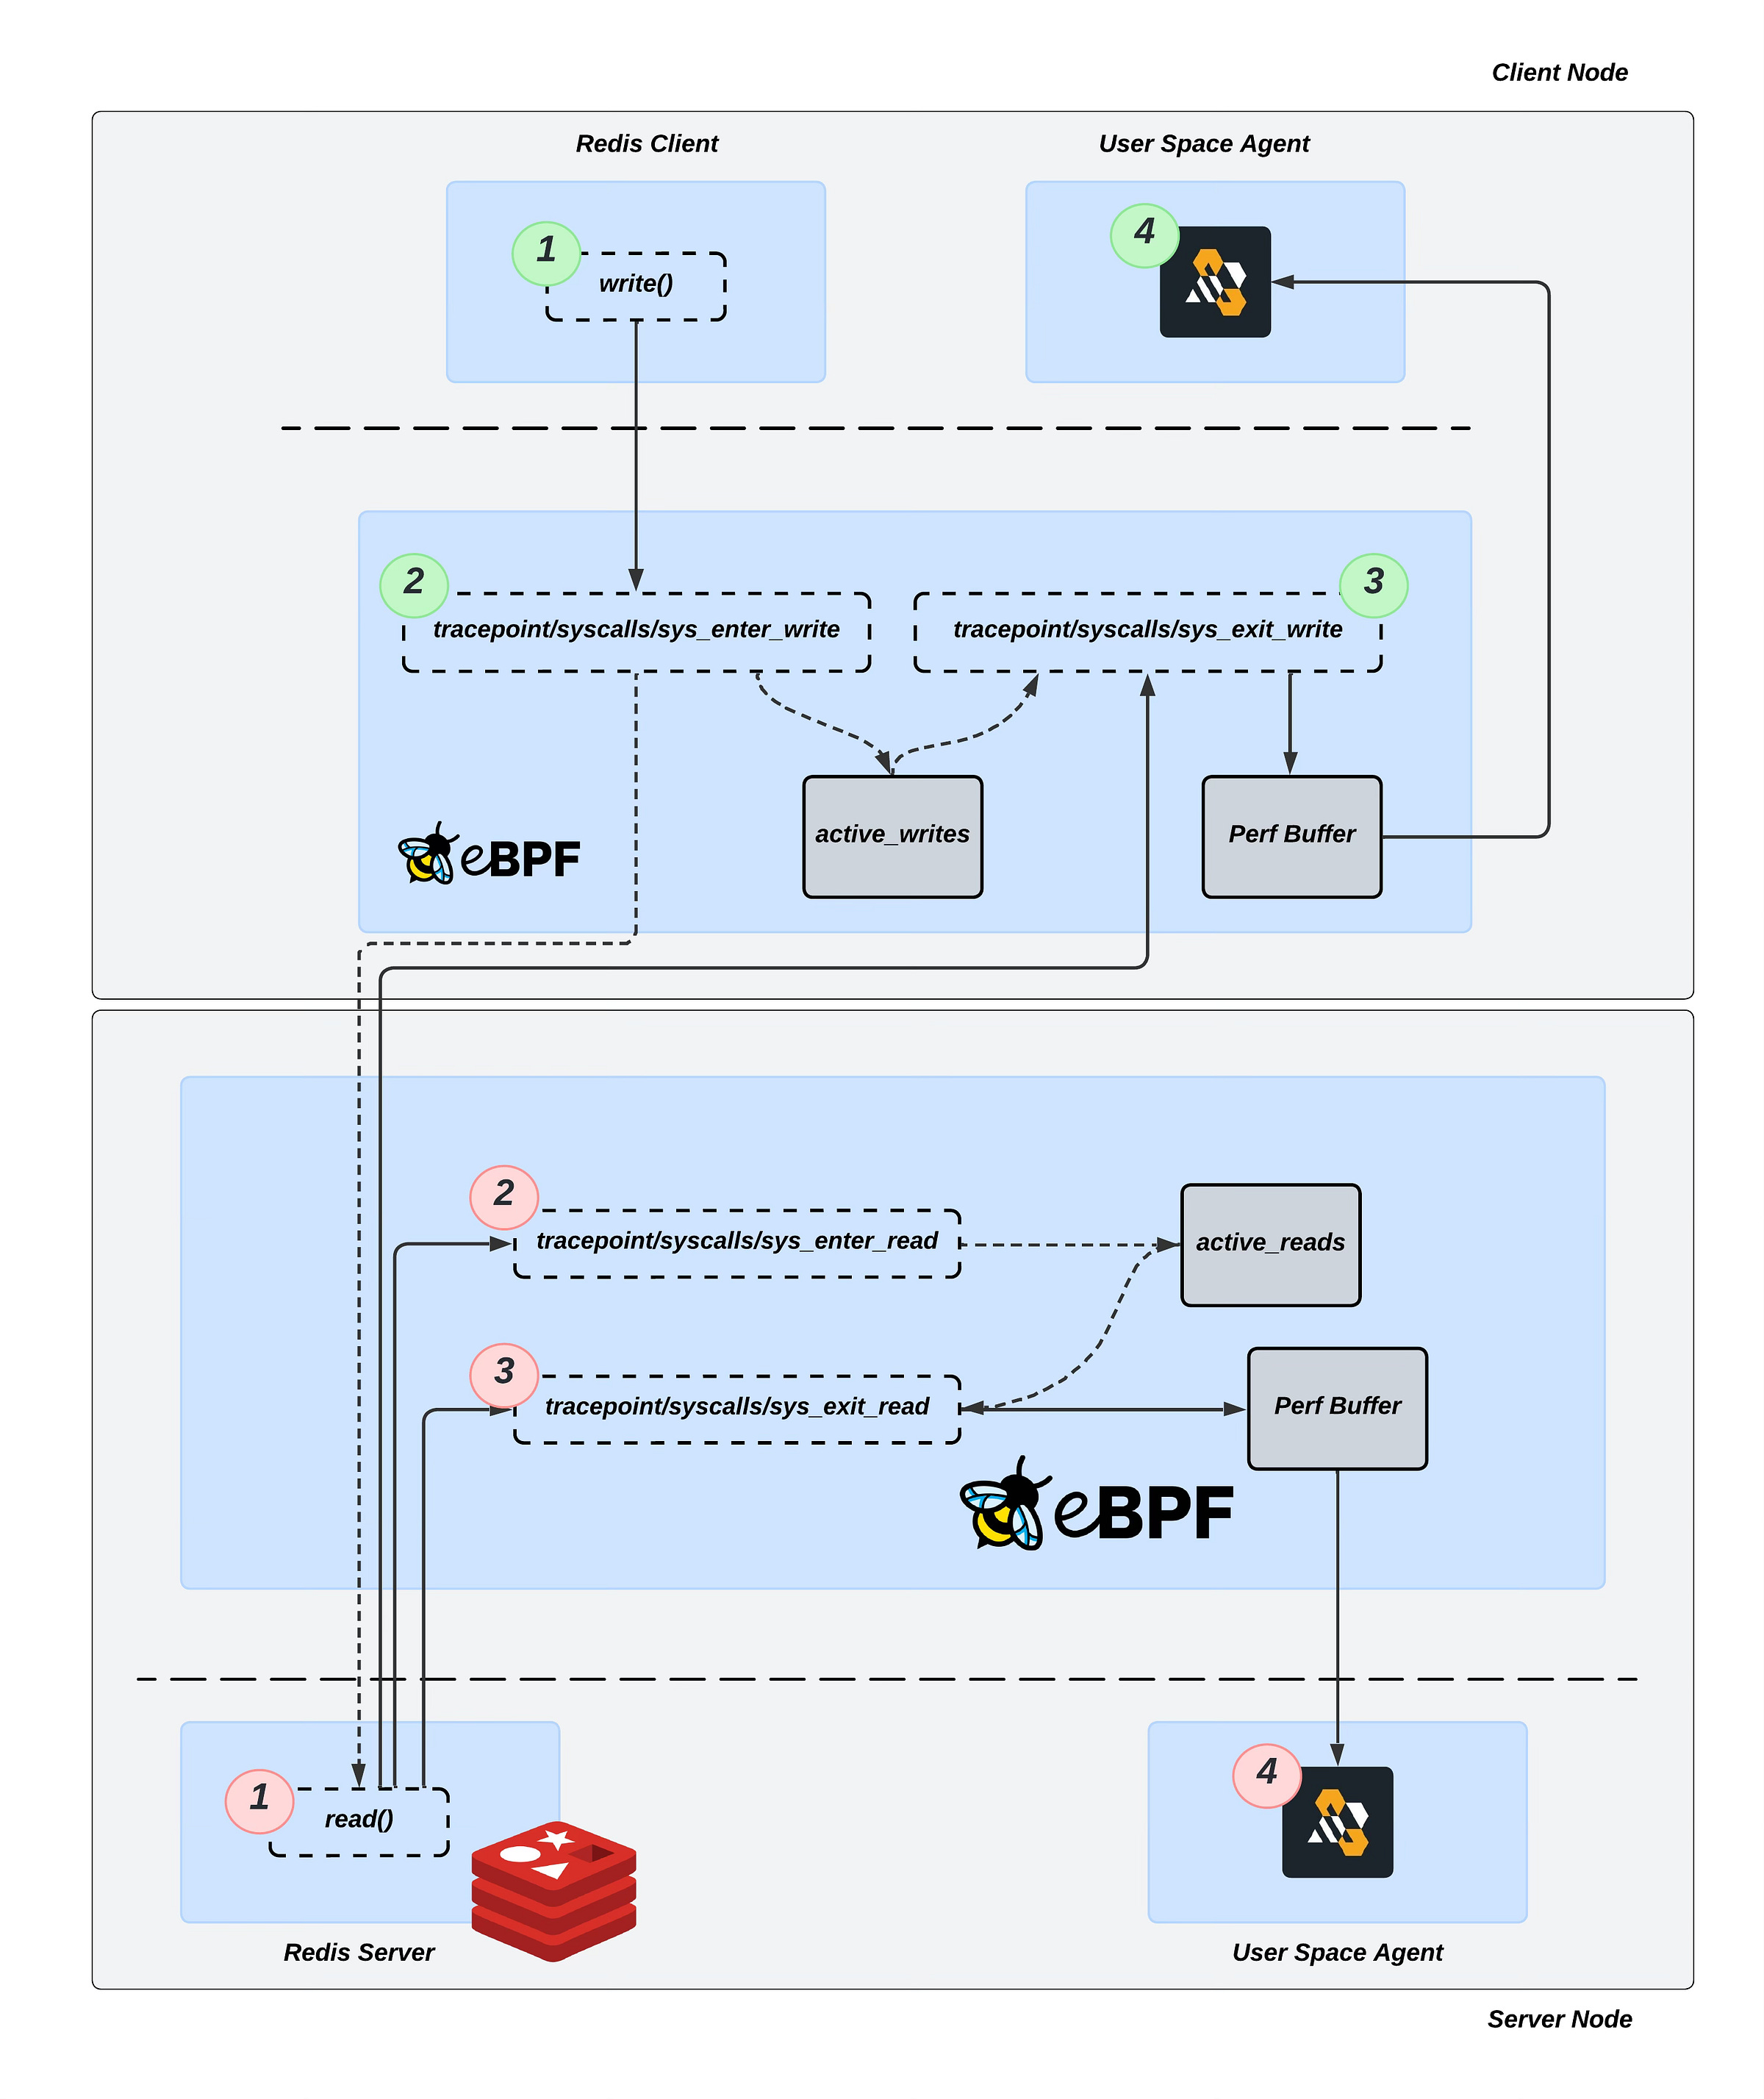
By tracing Redis operations, I observed that after a client creates a socket and establishes a connection with the server, the client invokes the write syscall to send data. Redis server then processes this data using the read syscall to receive the client’s command.
Therefore, the objective is to attach to these syscall tracepoints:
tracepoint/syscalls/sys_enter_write: Triggered onwritesyscall and used to capture clients’ command data. Provides access to the input arguments of thewritesyscall. Forwards input arguments to thesys_exit_writefunction through theactive_writeseBPF Map.tracepoint/syscalls/sys_exit_write: Triggered on the exit ofwritesyscall and used to capture request/command latency. Provides access to the return values of thewritesyscall. Forwards the input arguments from theactive_writeseBPF Map and the write latency to the user space through the Perf Buffer.tracepoint/syscalls/sys_enter_read: Triggered on the enter ofreadsyscall and used to capture received data. Provides access to the input arguments of thereadsyscall. Forwards input arguments to thesys_exit_readfunction through theactive_readseBPF Map.tracepoint/syscalls/sys_exit_read: Triggered on the exit ofreadsyscall. Provides access to the return values of thereadsyscall. Forwards the input arguments from theactive_readseBPF Map and the read latency to the user space through the Perf Buffer.
These hook points provide us access to connection file descriptor, socket address, and Redis commands, including their type, parameters and more.
💡 In the context of eBPF programs, the in-kernel attachment points are commonly referred to as Hooks or Hook points. Each hook point varies primarily in terms of which in-kernel data types and variables it can access.
During the write and read syscall our tracepoint program should be able to parse the data and store it for further processing.
Let’s consider a simple example, to demonstrate how RESP protocol can be decoded:
*3 $3 SET $4 name $9 ebpfchirp*3: The*character is used to specify an array data type, and the number3indicates that the array contains three elements.$3: The$character specifies a bulk string “SET”, and the number3indicates that the string length is 3 characters.SET: This is the first element of the array and a Redis command to set a key to a specified value.$4: Similar to the previous$3, this indicates another bulk string “name” with a length of 4 bytes.name: This is the second element of the array, representing the key to be set.$9: This indicates a bulk string “ebpfchirp” with a length of 9 bytes.ebpfchirp: This is the third element of the array, representing the value to be set for the key.
This is just one of the possible commands in RESP. The protocol supports various other types of data structures, each with its own prefix:
Simple Strings: Prefixed with
+Errors: Prefixed with
-Integers: Prefixed with
:
I've implemented this decoding logic in eBPF, along with additional support for other Redis commands as well.
I find code example renders in Substack tedious, so I’ll refer to my GitHub repository with the code.
Here’s the link.
💡 Hint: I’ve added some useful code comments for you to check — as always :)
For the sake of completeness, let’s run it.
⬅️ On the left side, we first see the Redis server running inside a Docker container. Next, we build and deploy the eBPF program to intercept and monitor the RESP protocol.
➡️ On the right side, we run a Redis client to execute some basic Redis commands, which allows us to observe the interactions in real time.
This works!
But what about the amount of overhead observability imposes on the host. In other words, is the additional CPU usage (a.k.a. cost) justified by the value of the observability data we gain?
Performance Evaluation
I conducted tests involving 10,000 requests and calculated the average overhead in terms of latency and CPU usage.
Redis was deployed in a Docker container with 4 CPU cores and 4 GB of memory.
The results indicate that the eBPF program adds a constant eBPF overhead of approximately 17µs on average.
Additionally, the average CPU load introduced by each hook is as follows:
1.89% for
tracepoint/syscalls/sys_enter_read11.69% for
tracepoint/syscalls/sys_exit_read4.26% for
tracepoint/syscalls/sys_enter_write
You can find the load testing programs in the
/perfdirectory of the repository referenced above.
These findings highlight the trade-off between the added latency and CPU load due to eBPF instrumentation and the benefits of detailed protocol observation and analysis.
⏪ Did you miss the previous issues? I'm sure you wouldn't, but JUST in case:
I hope you find this resource as enlightening as I did. Stay tuned for more exciting developments and updates in the world of eBPF in next week's newsletter.
Until then, keep 🐝-ing!
Warm regards, Teodor


