
Can eBPF Provide Real-Time PostgreSQL Insights Without Degrading Performance?

Database engineers know very well how important it is to observe and monitor databases.
And it’s not just about tracking resource usage or catching failures—it’s about optimizing performance, detecting malicious queries, and keeping costs under control.
But one often not only needs highly granular information to fully understand what’s happening under the hood, but also must ensure that the added observability code does not significantly impact the database’s performance.
While there are many database solutions out there, we’re going to look at how to observe PostgreSQL using eBPF.
Can eBPF provide a low-overhead, high-visibility solution?
What impact does it have on database performance?
Is it even practical for real-world deployments?
Let’s find out.

Among the many message formats in PostgreSQL for executing SQL commands, the two we will primarily be concerned with are:
Simple Query: Executes a single SQL command sent as a single string using the
Qmessage type, providing straightforward and direct execution of queries likeSELECT * FROM users.Extended Query: Uses a multi-step process involving
Parse,Bind,Execute, and other message types to support complex interactions, including parameterized queries and prepared statements.
It’s not necessary for you to learn these formats, but we need to know about them to be able to parse the protocol in the eBPF program.
When a PostgreSQL client tries to write data to the database, the programming library internally triggers the write syscall to send data over the socket.
The receiving end of the socket then internally triggers the read syscall to receive data from the remote peer.
Therefore, the objective is to attach our eBPF programs to these syscall hook points:
tracepoint/syscalls/sys_enter_write: Hooks onto awritesyscall and is used to capture sent data. Provides access to the input arguments of thewritesyscall.tracepoint/syscalls/sys_enter_read: Hooks onto the entry of thereadsyscall and is used to capture received data, providing access to the input arguments of thereadsyscall.tracepoint/syscalls/sys_exit_read: Hooks onto the exit of thereadsyscall, providing access to the return values of thereadsyscall.
These hook points provide us access to the connection file descriptor, socket address, and PostgreSQL query data, including their type and parameters.
While it’s not directly necessary to utilize all three hook points, we can capture PostgreSQL protocol data on both the client and server sides.
Which hooks you use depends on whether you are trying to observe the database client or the database instance.
💡 For the sake of simplicity, we’ll only focus on observing unencrypted traffic. If you are interested in observing encrypted traffic, check out one of my previous posts.
![What Insights Can eBPF Provide into Real-Time SSL/TLS Encrypted Traffic and How? [Sponsored]](https://substackcdn.com/image/fetch/$s_!Jkmf!,w_140,h_140,c_fill,f_webp,q_auto:good,fl_progressive:steep,g_auto/https%3A%2F%2Fsubstack-post-media.s3.amazonaws.com%2Fpublic%2Fimages%2Fa520d4b0-98b9-4b3e-92af-c5fc28c84081_2000x1354.png)
Using this we can write an eBPF Program.
💡 Link to the complete code is available at the bottom of this post.
During the write syscall, we capture PostgreSQL query data using our eBPF tracepoint program tracepoint/syscalls/sys_enter_write and parse it using the following function:

Then, on the receiving side, we similarly capture the data (such as the file descriptor and the query payload) using tracepoint/syscalls/sys_enter_read and parse it.
This data is then forwarded to a tracepoint at the exit of the read syscall, tracepoint/syscalls/sys_exit_read, for protocol classification.
Last but not least, the tracepoint on the exit of the read syscall then performs message identifier checks, specifically examining the first byte of the message using the following function:
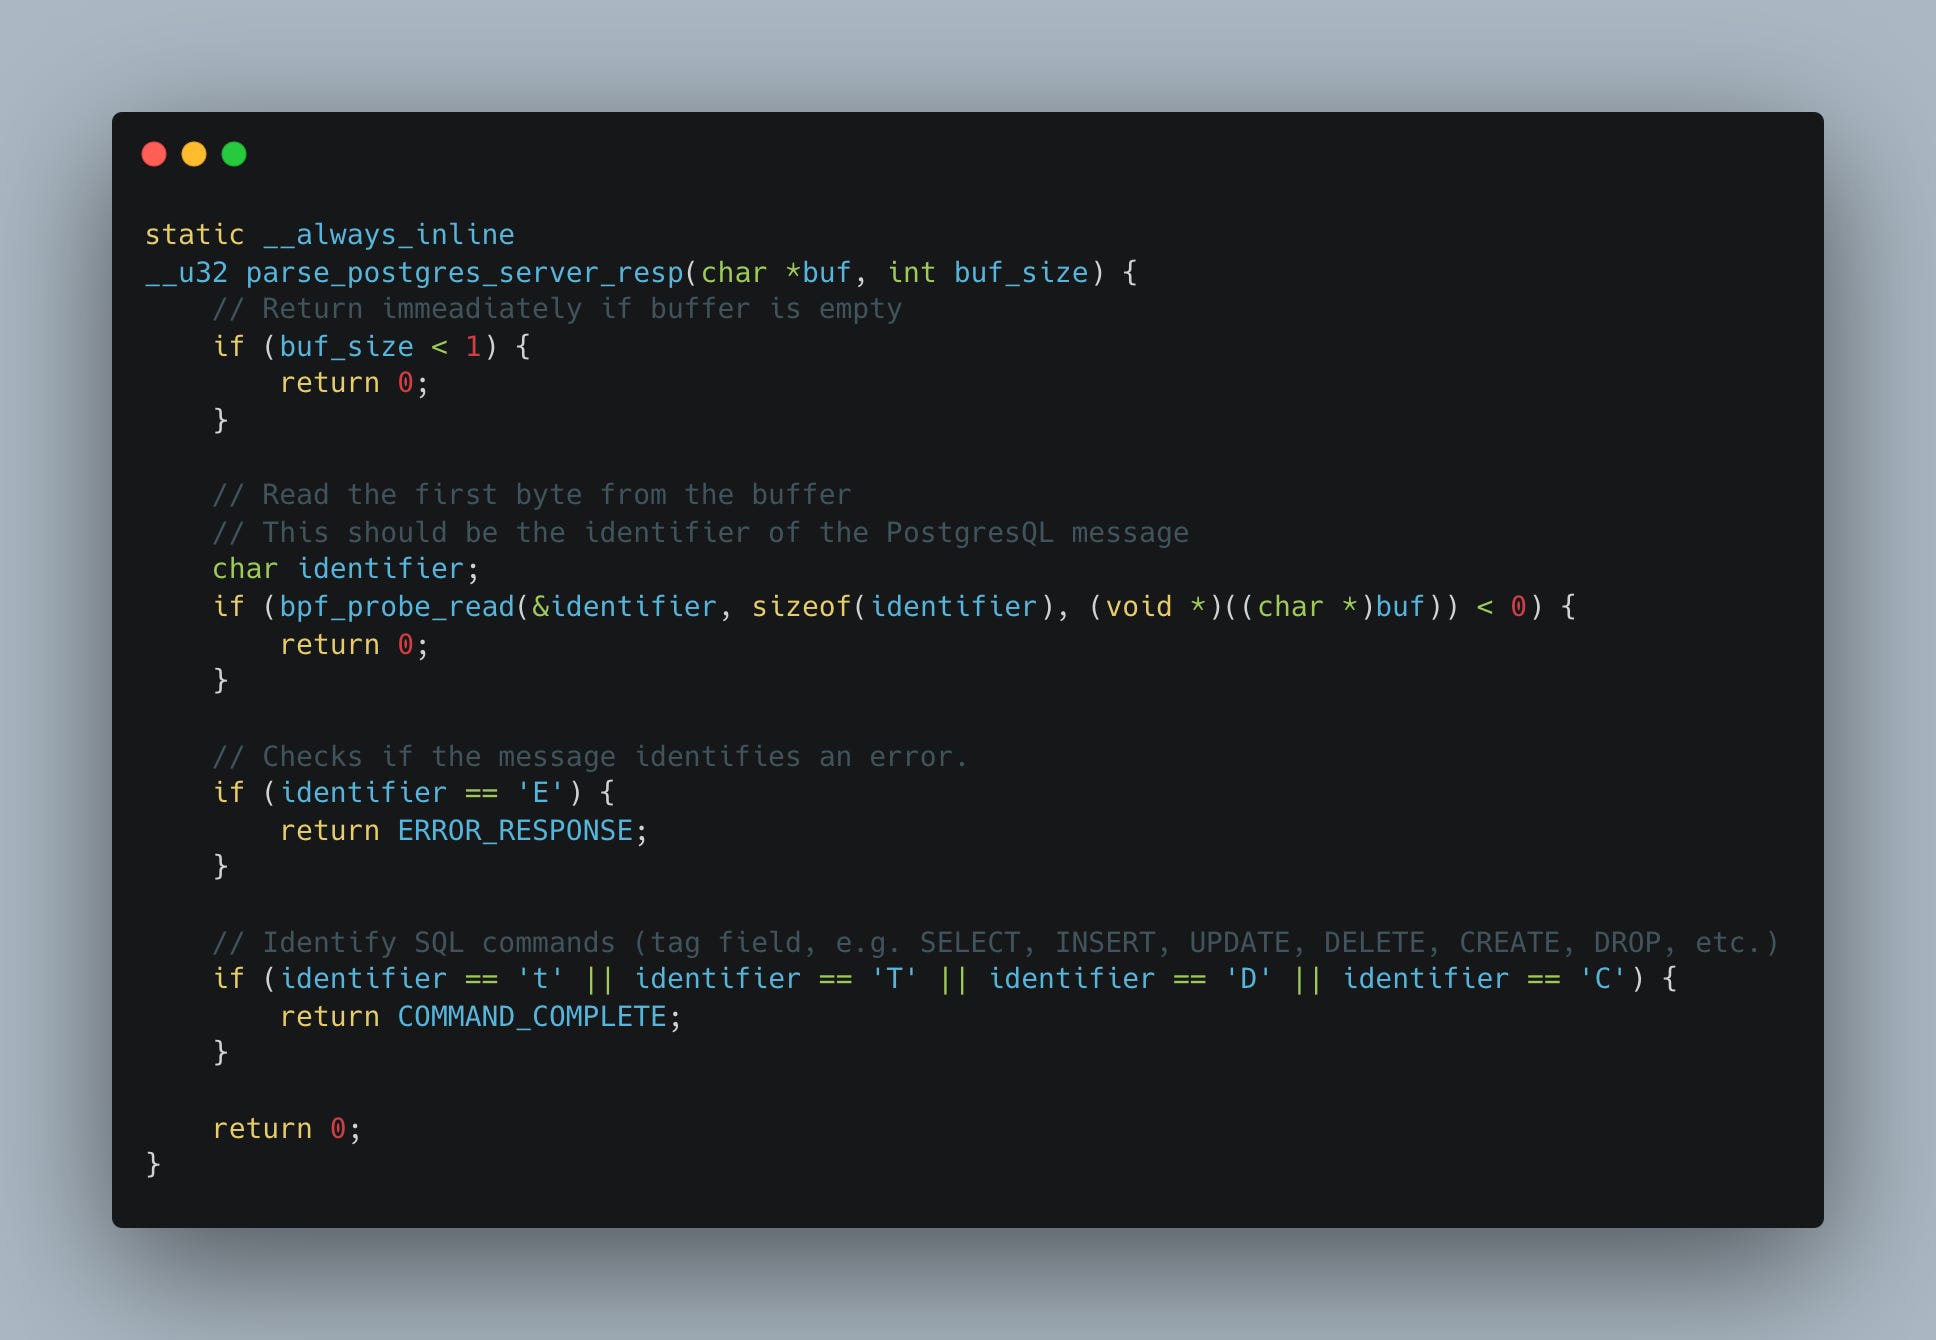
Once the message format is classified and parsed, its data is sent through the perf buffer to user space.
While this was very technical and involved understanding the PostgreSQL protocol to be able to parse it, I also want to shed some light on the performance implications of this intermittent eBPF program that captures and parses PostgreSQL data.
We’ll specifically focus on the added latency and CPU load metrics.
If you want to run the tests yourself, deploy the PostgreSQL container locally using:

I’ve configured my deployment with some commonly recommended memory settings:

And then evaluated the setup both with and without the eBPF programs:

💡 The results are based on the average of 10,000 measurements.
The results indicate that the eBPF program adds a constant overhead of approximately 0.03 ms on average.
The average CPU load (measured using bpftop) introduced by the eBPF program was:
0.4% for
tracepoint/syscalls/sys_enter_read1.41% for
tracepoint/syscalls/sys_exit_read, and0.8% for
tracepoint/syscalls/sys_enter_write.
💡 You can find the load testing programs in the
/perfdirectory of the repository referenced below.
Code Example
I find code example renders in Substack tedious, so I’ll refer to my GitHub repository with the code and test results.
Here’s the link.
⏪ Did you miss the previous issues? I'm sure you wouldn't, but JUST in case:


I hope you find this resource helpful. Keep an eye out for more updates and developments in eBPF in next week's newsletter.
Until then, keep 🐝-ing!
Warm regards, Teodor