eBPF Map Pressure using eBPF Iterators
eBPF Map Metrics Prometheus Exporter
To my surprise, I discovered there is no straightforward method to determine the number of elements stored in an eBPF map. This got me a bit concerned — how can I ensure my eBPF Maps won’t become full and drop entries, potentially affecting application performance?
In this newsletter, I describe the various challenges I encountered while developing a solution to this problem.
The Problem
Whenever you're working on an eBPF program or any other user-space application, there's always a strong desire to monitor and understand its behavior once it will be running in production.
In light of that, Netflix has developed a tool called bpftop, which helps you address questions like:
How much CPU load does my eBPF program impose on the host?
What is the average runtime of my eBPF program?
How many times is my eBPF program triggered?
But not just eBPF programs, also eBPF Maps can be the bottleneck of your applications.
💡An eBPF map is a key-value data structure used to efficiently store and share data between eBPF programs and user space, enabling dynamic data exchange and state tracking across kernel and user applications.
Each eBPF map has a predefined size, and if it reaches full capacity, this can have serious effects on your application. For example:
Events sent to user-space applications through Kernel Ring Buffer may be dropped if they cannot be processed quickly enough
If new entries cannot be added, it can cause data lookups to fail and impact network traffic decisions
Hitting the map size limit while collecting metrics through eBPF maps can result in incomplete data, leading to inaccurate monitoring and alerts.
This creates an inherent need for monitoring eBPF Maps as well.
The Solution
Since I couldn't find an existing tool to monitor my eBPF maps, I decided to build one myself.
Ideally, my eBPF Map Monitoring solution would:
Export real-time metric values.
Include all eBPF maps on the host.
Operate independently of eBPF map reloads and the program’s own restarts.
Have minimal CPU footprint.
This seemed like an easy task at first, but I encountered several challenges.
❌ Idea #1 - Hook onto Map Update Kernel Function
Develop and hook eBPF programs fentry/htab_map_update_elem and fentry/htab_map_delete_elem into the kernel, which will be (asynchronously) triggered on every map entry update and deletion. This will allow me to track changes, such as updates and deletions of key-value pairs, and export metrics accordingly.
Problem — This approach will ONLY correctly track the maps loaded after the exporter is already running. For example, if we load it after the eBPF programs we want to track, the number of elements in its eBPF maps might already be non-zero, and our map metrics exporter would incorrectly start tracking from a value of 0. To my knowledge, there is no in-kernel function or user-space API to retrieve the list of all updated keys beforehand to preset the offset, a.k.a. the initial number of elements, before the updates by the fentry hooks.
❌ Idea #2 - Track only Pinned Maps
Track ONLY pinned eBPF maps, as most production environments pin them to retain their map entries in case of program restarts anyway. Therefore, walk through the eBPF filesystem, load all pinned maps, and count the elements in each (and do it regularly).
Problem — This method does NOT support non-pinned maps.
❌ Idea #3 - Directly in the App
Integrate monitoring directly into your application that also loads the eBPF maps.
Problem — This approach allows tracking both pinned and non-pinned maps, but ONLY for the application that also loaded our map metrics exporter program. If there are any other eBPF programs on your host with their own eBPF maps, they won’t be tracked.
The 3 attempts may sound discouraging, but in fact, there is a solution.
✅ Idea #4 - eBPF Iterator
Utilize an eBPF Iterator iter/bpf_map to gather eBPF Map metrics on demand.
But what is even an eBPF Iterator?
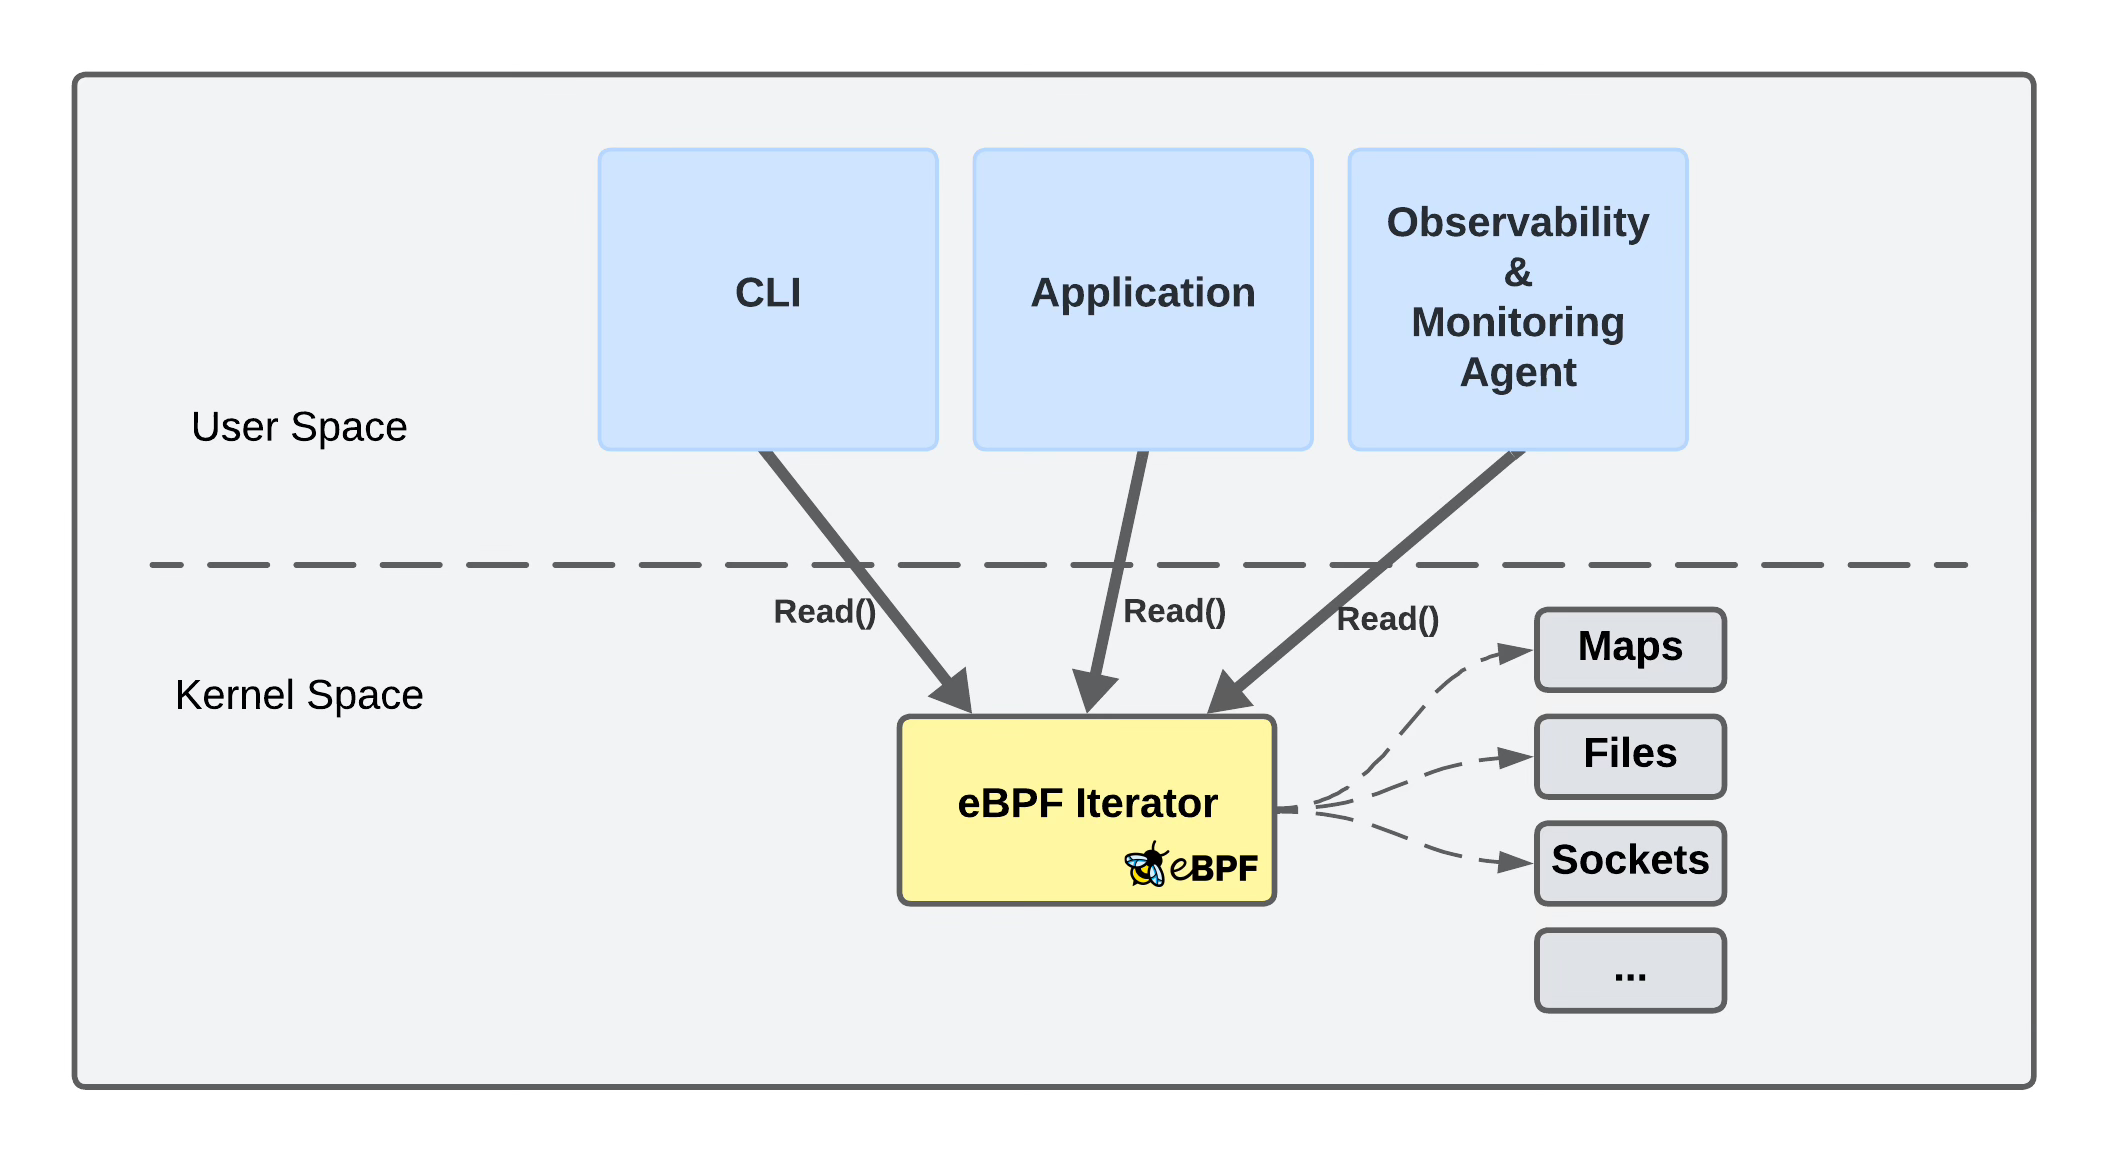
An eBPF Iterator is a type of eBPF program that allows user-space programs to iterate over specific types of kernel data structures by defining callback functions that are executed for every entry in various kernel structures.
For instance, user-space applications can utilize eBPF Iterators to:
List all eBPF programs currently loaded in the kernel and provide metrics such as the number of times each program has been executed, along with their respective execution time.
Iterate through all tasks (processes) running in the system and gather metrics like CPU usage, memory consumption, and status of each task.
Track TCP connections on IPv4 and IPv6 respectively, providing information such as connection states, packet counts, and byte statistics
Gather information about virtual memory areas (VMAs) allocated by tasks, including their start and end addresses, permissions, and associated files
and on and on..
One of the iterators, namely iter/bpf_map, allows us to traverse through all eBPF maps in the kernel and gather statistics about their entries. This includes the type of map (hash, array, etc.) and the total number of key-value pairs.
Solution Code
Using an eBPF Iterator, I built an eBPF Map Metrics exporter that exports metrics at regular intervals, including all eBPF maps on the host, operating independently of eBPF map reloads or program restarts.
I find code example renders in Substack tedious, so I’ll refer to my GitHub repository for the details.
Here’s the link.
🎥 Here’s also a video demonstration.
⏪ Did you miss the previous issues? I'm sure you wouldn't, but JUST in case:
I hope you find this resource as enlightening as I did. Stay tuned for more exciting developments and updates in the world of eBPF in next week's newsletter.
Until then, keep 🐝-ing!
Warm regards, Teodor


