Tracepoints, Kprobes, or Fprobes: Which One Should You Choose?
The art of writing eBPF Tracing programs
It is safe to say that almost all eBPF programs can extract and send kernel event data to user space applications.
However, tracing programs like kprobes, fprobes, and tracepoints are often preferred because they hook onto kernel events with access to rich, actionable data for tasks like performance monitoring or syscall argument tracing.
But their overlapping functionality can make choosing the right one confusing.
Today’s newsletter covers how to use each and why prefer one over another.
Tracepoint
Tracepoints are predefined hook points in the Linux kernel, and eBPF programs can be attached to these tracepoints to execute custom logic whenever the kernel reaches those points.
For example, the sys_enter_execve tracepoint captures the entry of the execve system call, providing information about the program being executed and its arguments, making it a valuable in things like auditing security events, or analyzing Linux user activity.
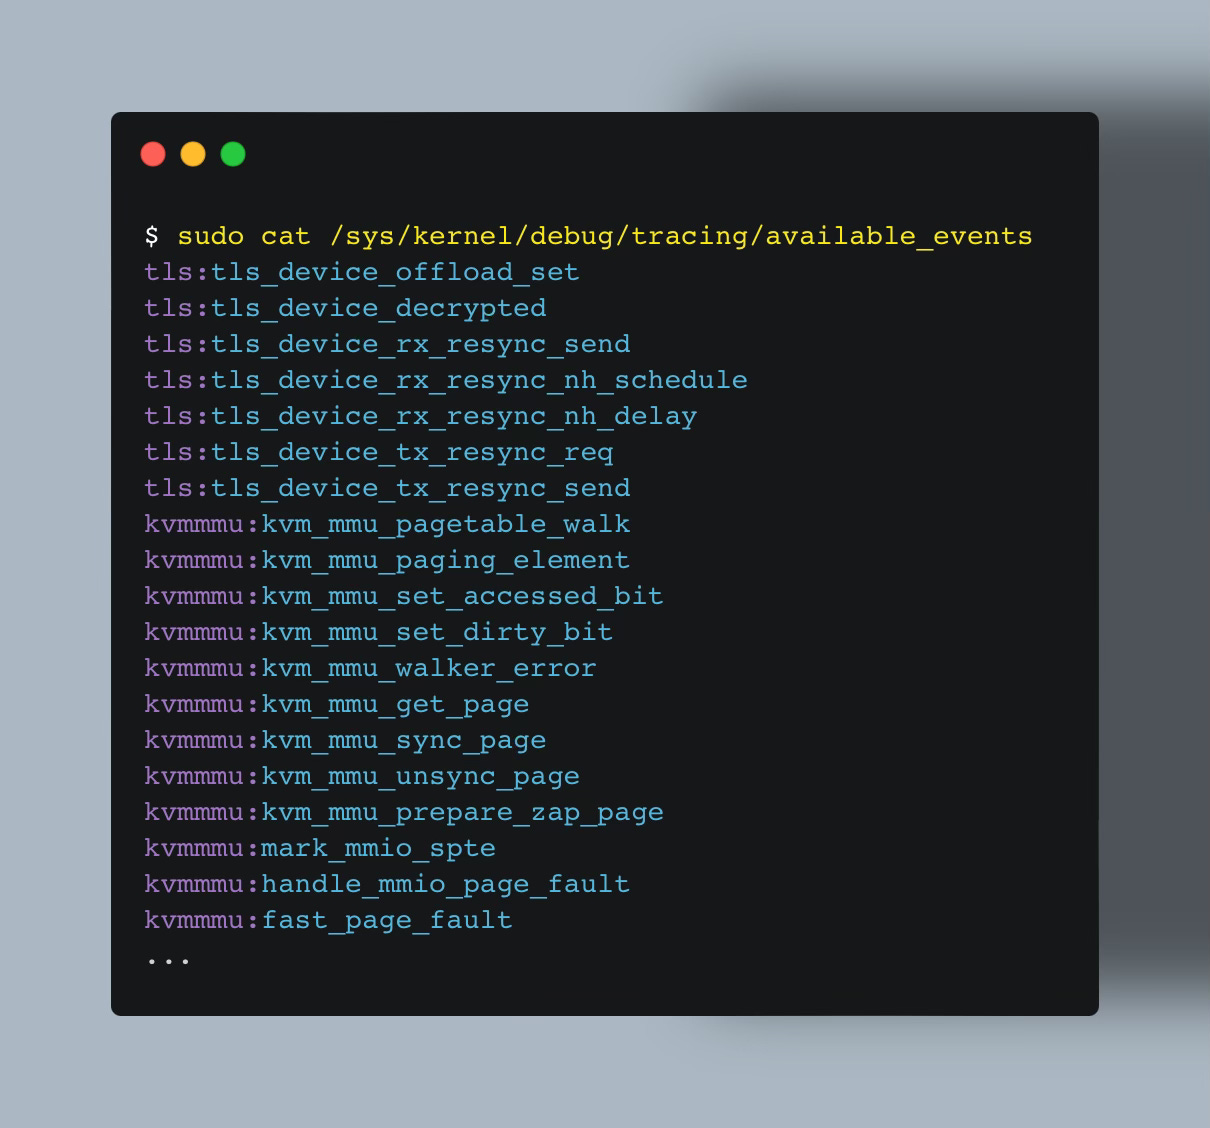
You can find all events that eBPF tracepoints can hook onto, using:
The output format is in the form <category>:<name>.
You can view the input arguments for a tracepoint by checking the contents of /sys/kernel/debug/tracing/events/<category>/<name>/format.
The first four arguments, are not accessible by the eBPF code. This is a choice that dates back to the original inclusion of this code.
💡 See explaination in commit 98b5c2c65c29.
But other fields can generally be accessed using our eBPF program like showcased at the bottom in the print fmt line.
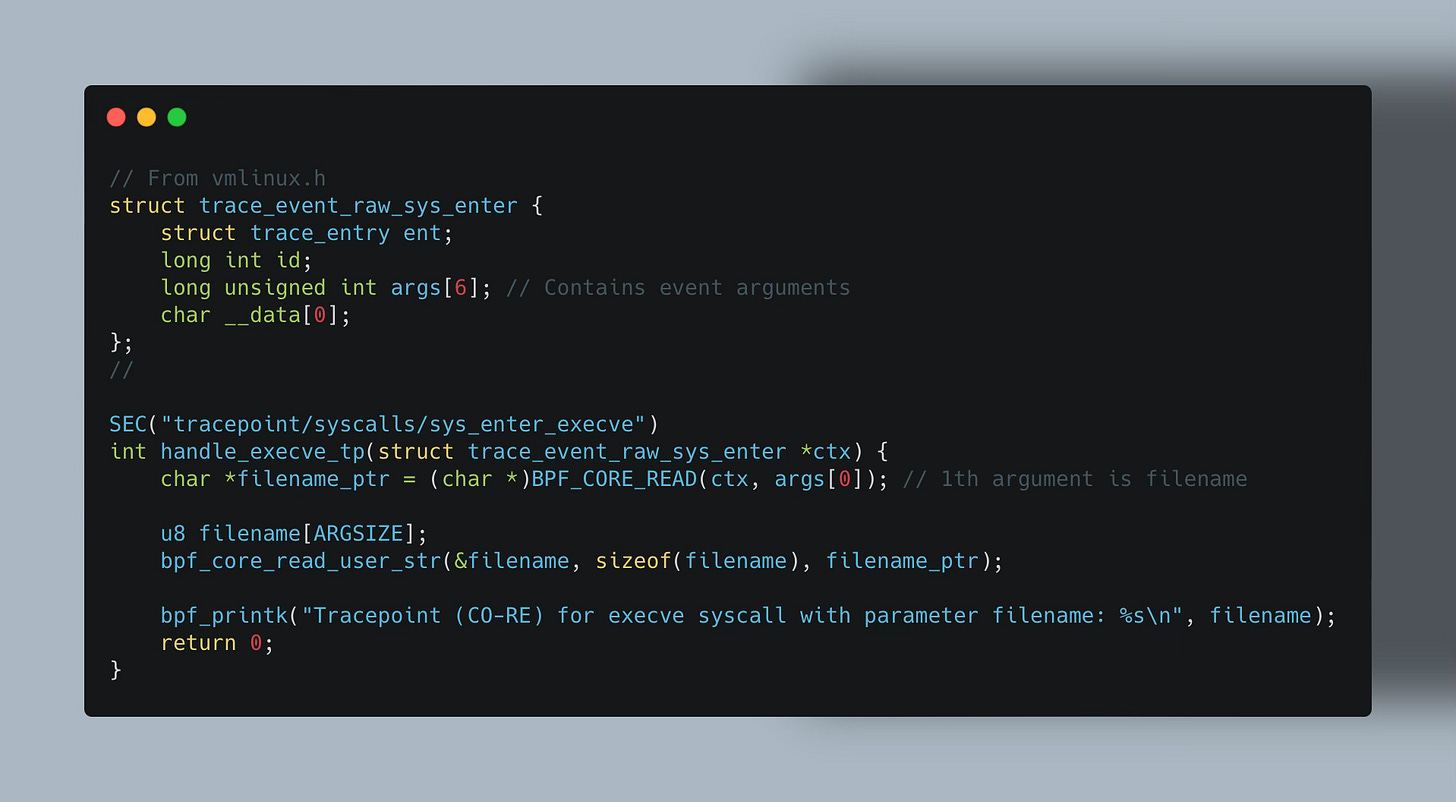
Using that we can write our eBPF Tracepoint program.
💡
SEC("tp/xx/yy")andSEC("tracepoint/xx/yy")are equivalent, and you can use either one according to personal preference.
But there are two downsides to this:
Tracepoints only exists in places where kernel devs have put them. If you need to trace something that isn't supported you need another technique.
Additionally, you need to make sure the tracepoint you are attaching to is available under your kernel version.
Making a tracepoint portable across different kernel versions is not significantly challenging. Tracepoints generally remain stable across kernel versions, and if they do change, we can utilize the BPF_CORE_READ() family of helpers for CO-RE relocatable reads.
Additionally, we must ensure the input context variable exists in the kernel where the program is loaded. For instance, with our custom struct trace_sys_enter_execve, it won't have a corresponding type in the kernel's BTF. This prevents CO-RE from adjusting instructions to read variables at the correct offsets if they differ across kernel versions.
Therefore, we need to use struct trace_event_raw_sys_enter defined in vmlinux.h.
💡vmlinux.his a kernel header file, providing access to kernel structures and definitions for eBPF programs.bpftool btf dump file /sys/kernel/btf/vmlinux format c > vmlinux.h
Due to a newsletter length limit, I will write more extensively about building portable eBPF programs and the usage of BPF_CORE_READ() and BPF_PROBE_READ() family of helpers in the next week’s post.
Raw Tracepoint
Raw Tracepoint may seem not much different than the regular Tracepoint. They are both able to attach to events listed in the /sys/kernel/debug/tracing/available_events file.
But the main difference is that raw tracepoint does not pass the input context to the eBPF program as tracepoints do — a.k.a. constructing the appropriate parameter fields. The Raw tracepoint eBPF program accesses the raw arguments of the event using struct bpf_raw_tracepoint_args.
Therefore, raw tracepoint usually performs a little better than tracepoint.
Another (rather large) difference is that, in the kernel, there’s actually no static defined tracepoints on single syscalls but only on generic sys_enter/sys_exit.
💡sys_enterhooks trigger on every syscall event entry, whilesys_exithooks trigger on its return, capturing the return value of the syscall.
Therefore, if we want to act on specific syscall kernel event, we need to “filter” by syscall ID inside our Raw Tracepoint eBPF program.
This is different than regular tracepoints that rely on perf events which allows them to directly attach to a specific kernel event like tp/syscalls/sys_enter_execve as showcased above.
💡 Perf events are a kernel feature for monitoring and profiling Linux systems, capturing hardware events (e.g., cache misses), software events (e.g., context switches), and kernel tracepoints.
Notice also that we are reading the arguments of the syscall by extracting them from the CPU registers. The System V ABI specifies which arguments should be present in which CPU registers.
Since we rely on CPU registers, we need to target our binary for specific system architectures. One way to achieve this is to provide a —-target flag if you are using clang.
💡 For the example above, I intentionally read the register value using
®s→di, while the rest of the examples will utilizePT_REGS_PARM*macros which should be preffered.
Kernel Probe (kprobe)
Regular and raw eBPF tracepoints might in fact be sufficient for your use case, but their main limitation is that they are limited to a set of predefined hook points (and perf events) in the kernel, disallowing you to trace arbitrary kernel events.
Kprobes alleviate this by allowing dynamic hooks into any kernel function, including within function body, not just at the start or return.
💡Some functions marked with the
notracekeyword are exceptions, and kprobes cannot hook onto them.
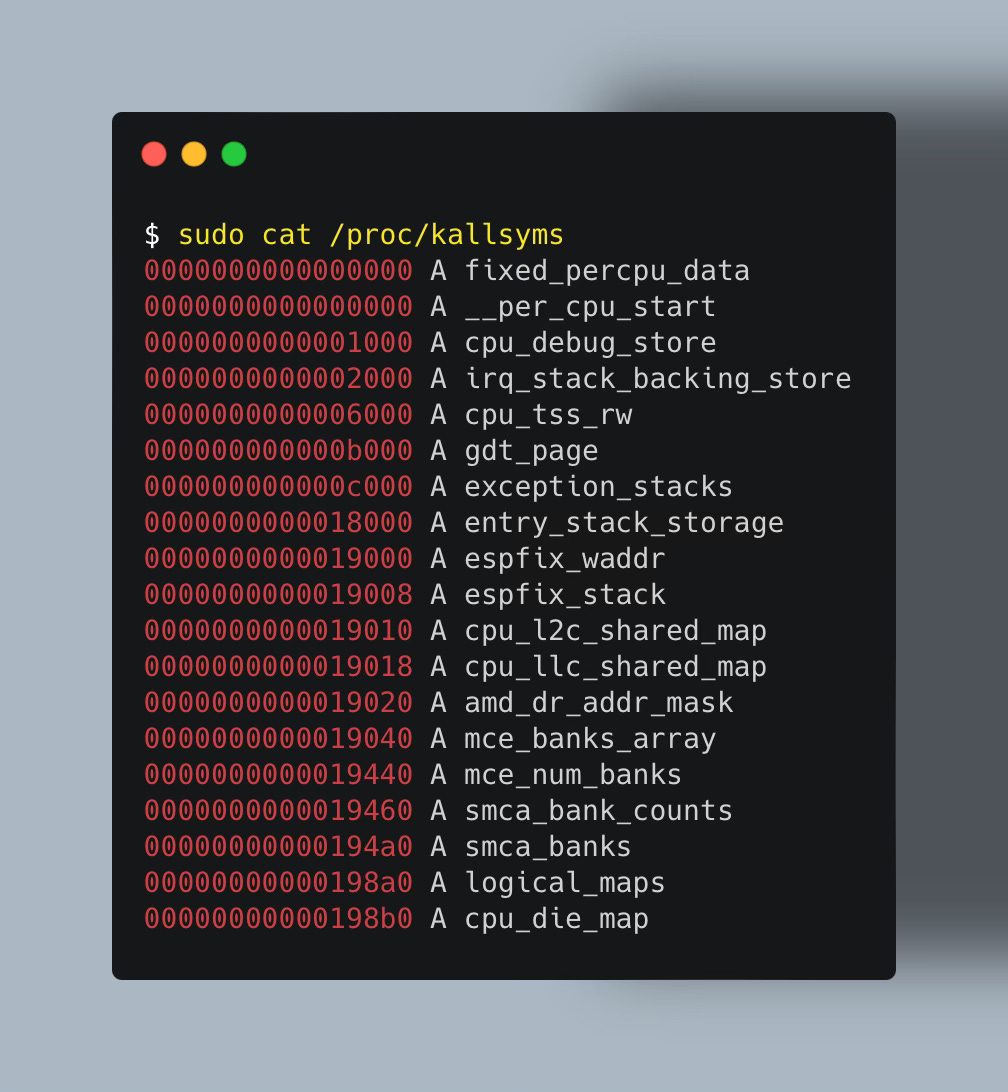
Conveniently, you can list all kernel symbols in /proc/kallsyms and find your function using grep:
💡 If a function is not in
/proc/kallsyms, it's likely because is was inlined at compile time. Also verify they are not blacklisted in/sys/kernel/debug/krpobes/blacklist.
But the issue with kprobes is that you depend on whatever code happens to be in the kernel your system runs and are not assured to be stable across different kernel versions. Functions might exist in certain kernel versions, while not in others, structs can change, rename, or remove a field you are using.
Meaning, while with eBPF tracepoints whose input context arguments don’t change much across versions, using BPF_CORE_READ() family of macros isn’t so critical. But this comes especially important when you want to write portable kprobes eBPF programs.
The same issues apply to kretprobes — kernel probes one can attach to the exit of the function.
Additionally, when we attach a kprobe, it’s similar to inserting a breakpoint in a debugger: the kernel patches the target instruction with one that triggers a debug exception (e.g., BRK on ARM64). When this instruction executes, the exception handler calls our probe handler.
And while this mechanism works well, it has a downside.
Each probe hit generates an exception, causing context switches and exception handling. That overhead may be negligible for infrequent probes, but if many probes are attached to “hot” kernel functions, performance can degrade significantly.
Is there some alternative to allow triggering eBPF programs with less overhead?
Yes — read along.
BTF-Enabled Raw Tracepoint
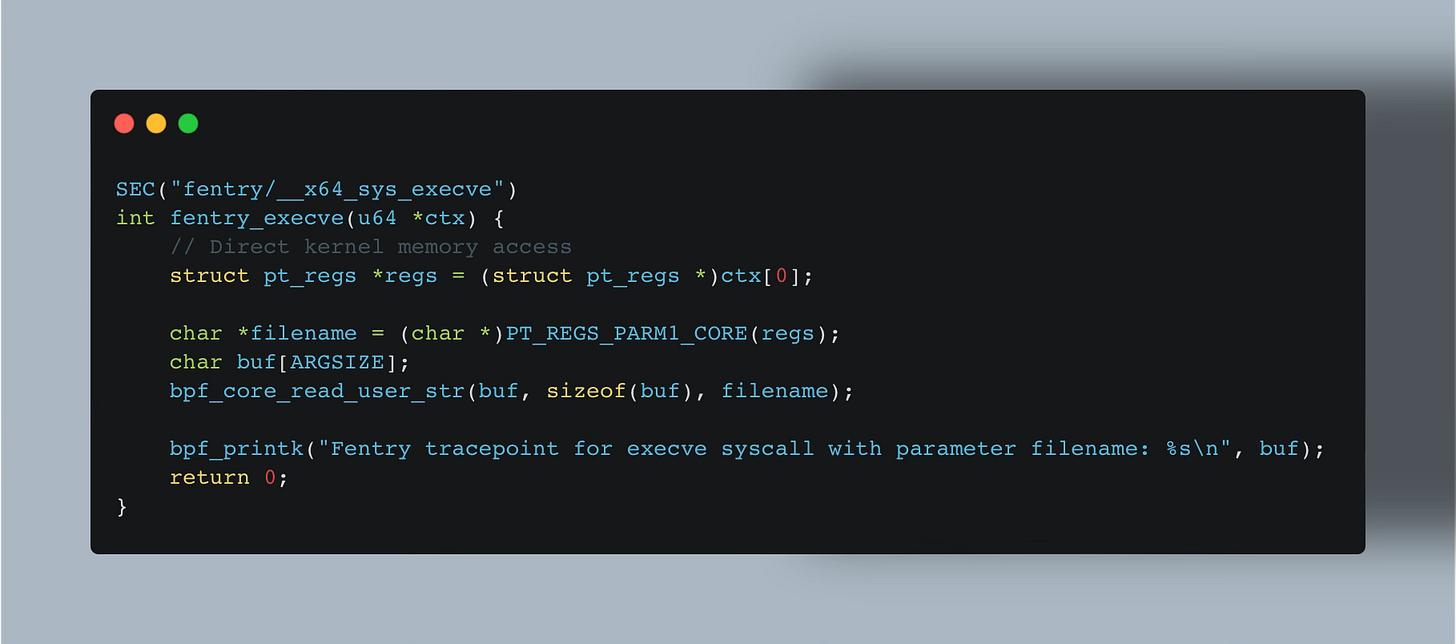
To one’s surprise, you don't always need to use BPF_CORE_READ() helpers to do CO-RE-relocatable reads. Sometimes you can just directly access kernel memory or I should say directly access input context arguments.
eBPF program types that allow this are BTF-enabled. Among such BTF-enabled eBPF program types are also BTF-enabled raw tracepoints and fprobes.
With such programs you can access kernel memory directly from within the eBPF program. There is no need to use a helpers like BPF_CORE_READ() or BPF_PROBE_READ() to access the kernel memory as in regular and raw tracepoint.
Programs for BTF-enabled eBPF programs are provided with an array of u64 values representing the arguments of the function being traced.
This makes the BTF-enabled tracepoint slightly more convenient to develop compared to the raw and regular tracepoints.
Fprobes (fentry/fexit)
As mentioned above, fprobes are also BTF-enabled, allowing it to directly access the input arguments passed to the program as array of u64 values.
You can think of them as CO-RE kprobes, although many will probably oppose me with that as this is not strictly correct. I say so, because using fprobes you can take advantage of BTF like we’ve seen in the tp_btf tracepoint example.
Unlike kprobes, fprobes can only attach to only kernel function entry points using fentry or exit points using fexit, as their attaching mechanism (eBPF trampoline) differs from that of kprobes.
As mentioned above, Kprobes patch an instruction to trigger a debug exception, adding context-switch and exception-handling overhead.
But, fprobes use the ftrace mechanism where the compiler inserts a NOP at each function entry, which can be patched at runtime into a trampoline.
The trampoline sets up arguments, calls the eBPF program directly, then returns to the function. By avoiding exceptions and using direct calls, fprobes attach/detach faster and run with much lower overhead.
Fprobes programs can also be attached to BPF programs such as XDP, TC or cGroup programs which makes debugging eBPF programs easier. Kprobes lack this capability.
Another advantage is that fexit hook has access to the input parameters to the function, which kretprobe does not.
They do however require at least kernel version 5.5 which might be an issue if you need to support older kernels, at least for now. But otherwise they are mostly superior to kprobes.
💡Kernel version 5.7 introduces another fprobe program type, named
Fmodify_returnwhich run after the fentry program but before the function we are tracing. They allow to override the return value of the kernel function.
Code Examples
Complete code examples can be found on my GitHub repository.
I hope you find this resource as interesting as I do. Stay tuned for more exciting developments and updates in the world of eBPF in next week's newsletter.
Until then, keep 🐝-ing!
Warm regards, Teodor


