
Troubleshooting Container OOM Kills with eBPF

Out of memory (OOM) kills are an early sign of saturation in Linux systems. It happens when a machine runs out of available memory space and starts killing processes until it can breathe again.
In the context of containers and tools like Kubernetes or Docker, OOMs happen when a container's memory usage exceeds its memory limits. The offending container processes get selected and OOM killed.
In more technical terms, container process receives a SIGKILL signal and terminates.
OOM kills might lead to unexpected service degradation and prompt a mild "How did that happen?" or "wtf just happened" depending on the situation from whoever is investigating the crime scene.
And an even bigger problem is that all “evidence” is mostly lost to the void as the offending process is gone. So yeah, back to the roots...
🚀 Special thanks to Arthur Picerna, Senior Observability Architect at Grafana Labs, for putting together this practical guest post for eBPFChirp!
So how do OOM kills really happen in environments like Kubernetes?
Container resource limits are enforced through cgroups.
And neither Kubernetes nor Docker have any control whatsoever over which process gets killed.
Instead it is the responsibility of the underlying Linux host kernel to enforce its resource boundaries.
But the kernel is not able to broadcast a request for volunteers to be killed, so the OOM killer has to apply a set of heuristics in an attempt to find the victim that will free the most memory while minimizing user anguish.
When the OOM kills occur, journal kernel logs display a memory cgroup out of memory message “Excessive container memory usage”.
Hence OOM kills, can be attributed to either:
Under-provisioned container memory
Faulty container application behavior
A bit of both 1. and 2.
Just imagine how an (unoptimized) process that needs to use a lot of memory for inbound requests might be prone to OOM kills.
Now imagine what happens in peak traffic conditions if one container goes down and the same load gets redistributed to the remaining containers while it restarts?
It’s quite likely to cause cascading failures.
If this process (chosen by the kernel) is the container's main process, then the main process will exit which will stop the container and that would typically trigger a container restart.
And it takes some time to restart a container — time which is not spent running its workload.
But the OOM killer could instead select a child process within the container's main process, then the container itself will outlive the OOM kill and new child processes might eventually respawn.
One could argue that is even worse because the symptom is much less obvious.
Unless you already know why OOMs happen and are fine with it, e.g. relying on OOMs to restart randomly chosen containers; they you obviously don’t need to worry about this at all.
But in most cases though you'd really want to be able to assert what is happening in your system at the time of the OOM kills.
That's where eBPF comes in.
ℹ️ cAdvisor metrics can be used to track containers memory usage and OOM kills to some extent. In this article we merely focus on exposing Linux kernel's internal memory management stats.
There are several ways to write an eBPF program that hooks into the oom_kill probe.
Both BCC and bpftrace, already provide examples for that — tools/oomkill.py for BCC and tools/oomkill.bt for bpftrace.
I found bpftrace syntax more concise and easier to understand so I tried running that locally, here is an example output:
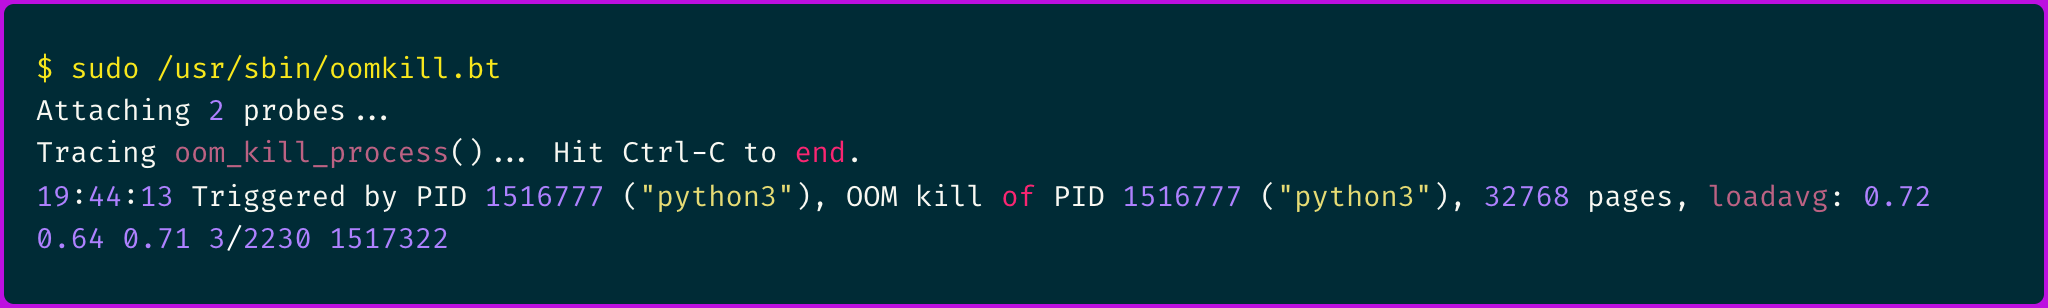
The above shows the process PID, total pages count and CPU loadavg, from the host perspective.
But that doesn't really give much container context, rather just information on the process level.
Let's see if we can change that.
Here is the original bpftrace oomkill probe code:
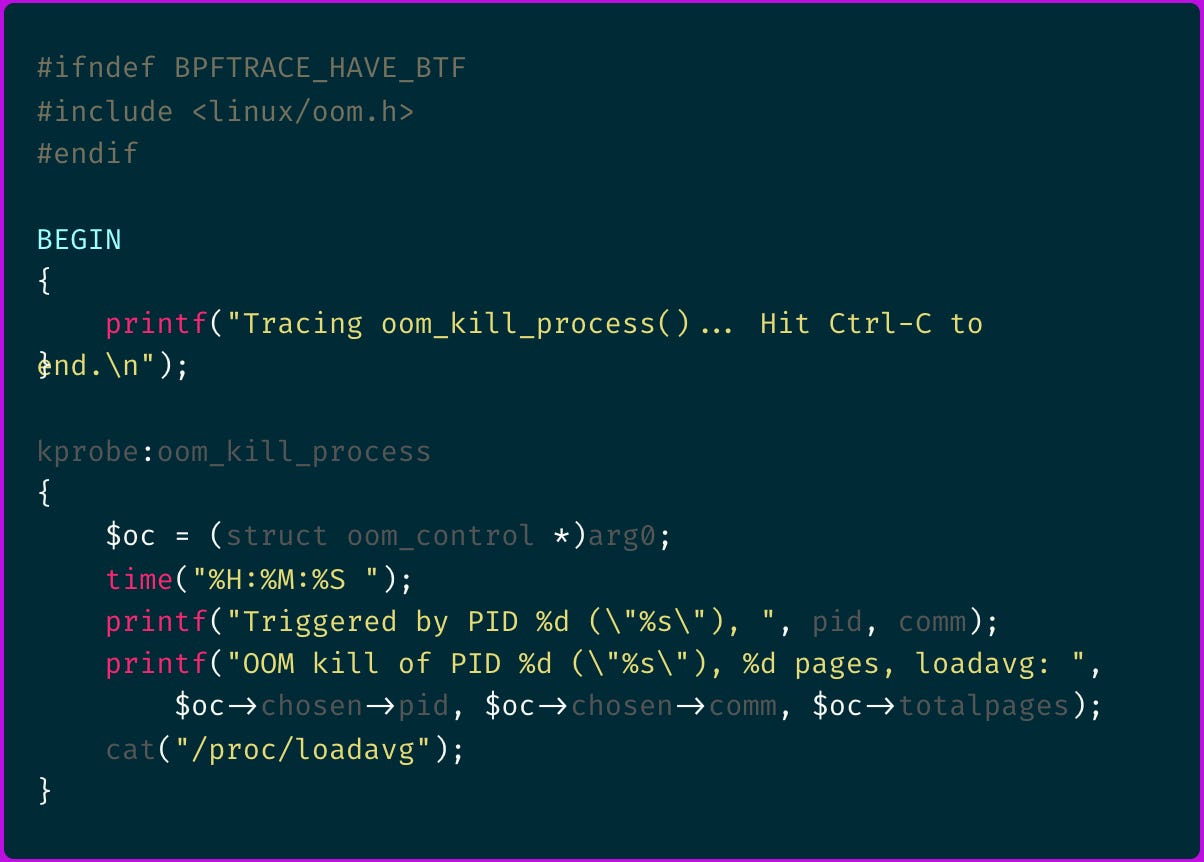
Let's make sense of it, starting with line kprobe:oom_kill_process.
It tells that we define a kernel probe (kprobe) that will hook onto the oom_kill_process() function. Makes sense.
What about $oc = (struct oom_control *)arg0;?
It tells that we receive the function's first argument arg0 and type cast it into an oom_control struct.
Going to the torvalds/linux GitHub repository and searching for the oom_kill_process() function declaration we can confirm the arg0 is in fact the oom_control struct.

But what's inside an
oom_controlstruct?
Traversing the source code again you find the following struct definition:
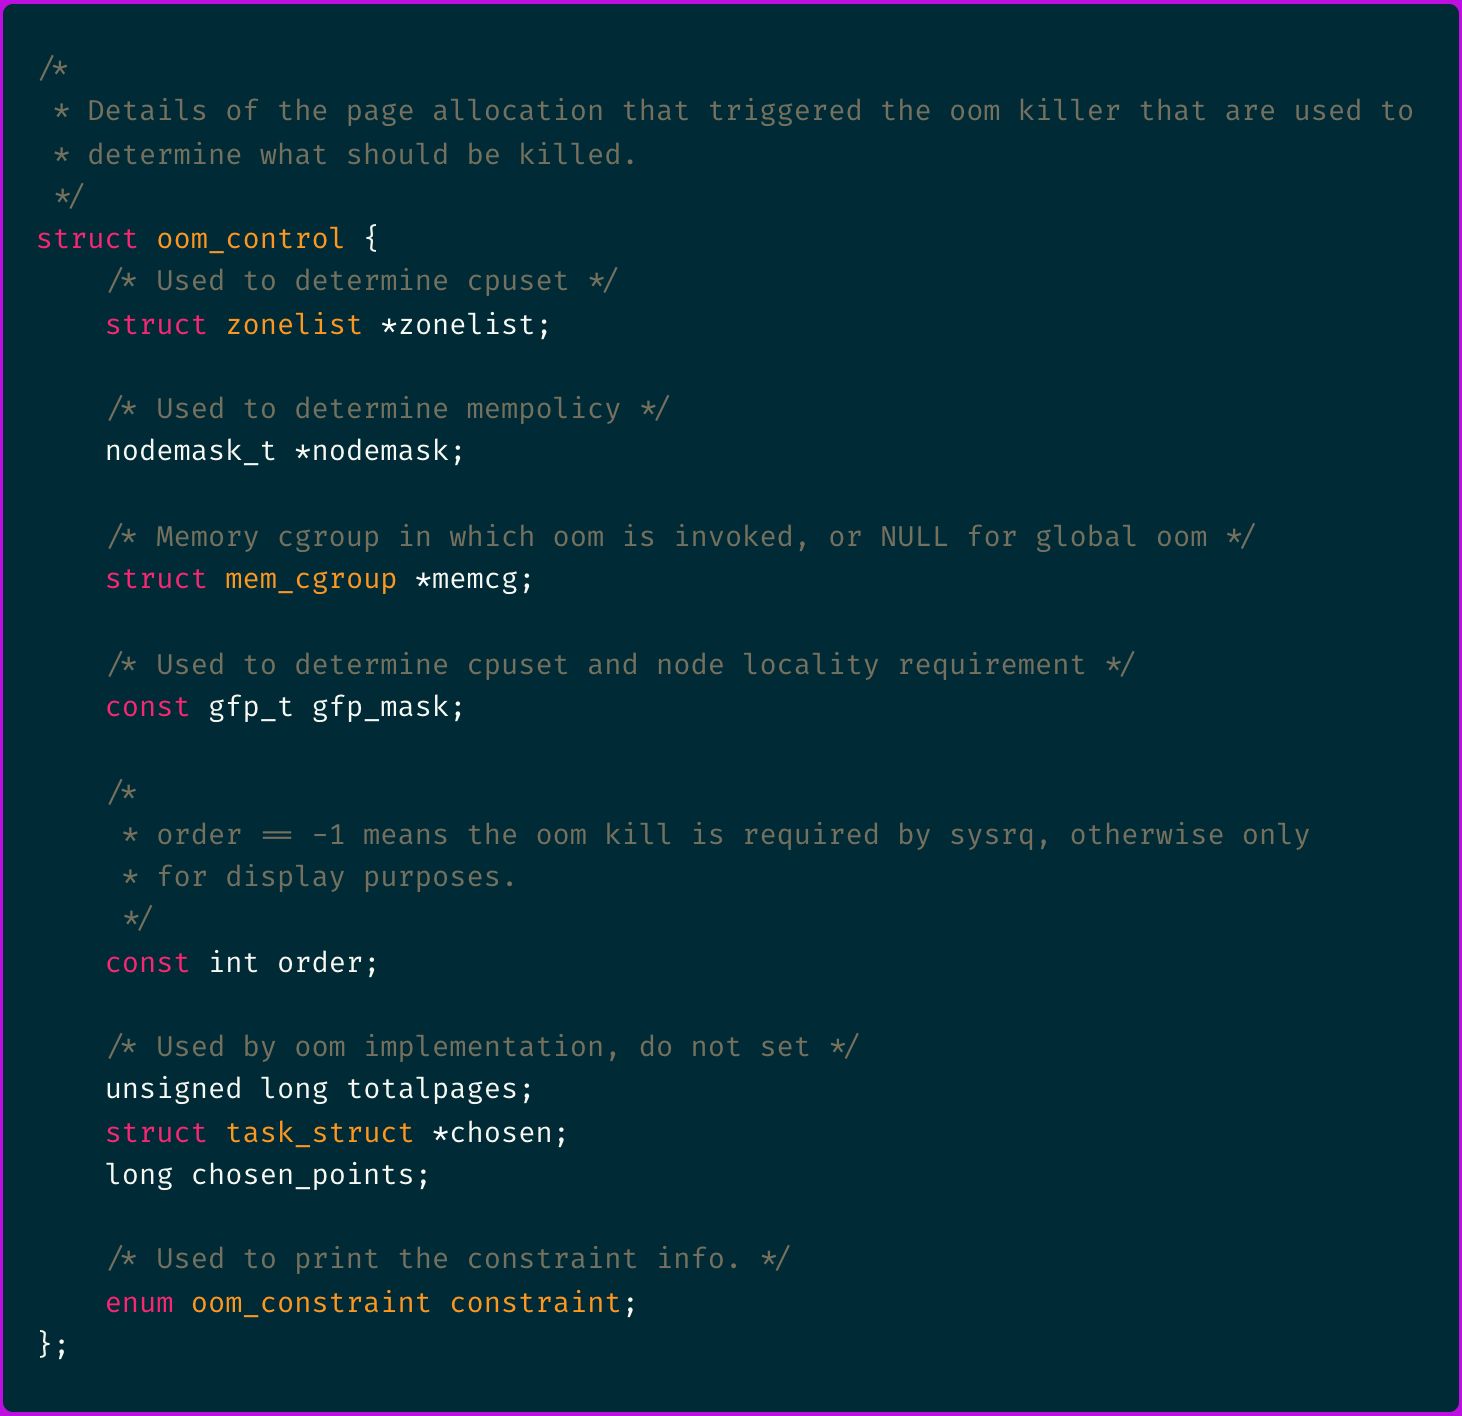
There's some interesting stuff in there.
We can see the:
totalpagesvariable which is read by theoomkilleBPF probe program.memcgis a mem_cgroup object that holds the container's cgroup memory usage and limits.chosenis a task_struct object that holds the chosen process properties amongst which you can findmmandnsproxythat respectively hold memory management and container's namespaces information.chosen_pointscomes from the oom_badness() score calculation that is used by the OOM killer to select which process to kill.
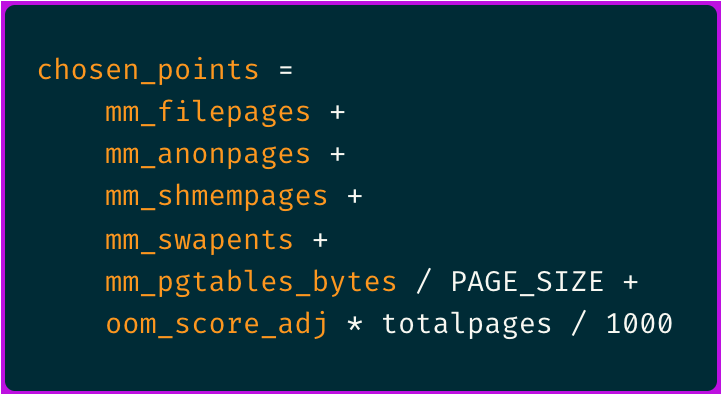
The formula for the OOM “badness” score calculation ends up looking something like this:
💡
PAGE_SIZEis a constant which may vary by system but is generally equivalent to 4096 bytes.
The sum of first four elements is actually the process resident set size (RSS):

In short, it's summing all of the process RSS memory footprint, counted in pages, plus some page tables space reserved by the kernel and an adjustable factor that can be set by the user per process.
The main take away is that the process with highest RSS, hence a higher number of oom badness points, is the most likely to get OOM killed.
And from the $oc->chosen->active_mm->rss_stat object you can access the various components of that process RSS.
As the above are the main variables which influence the OOM killer's process selection let's see if we can include them in the output of the bpftrace probe.
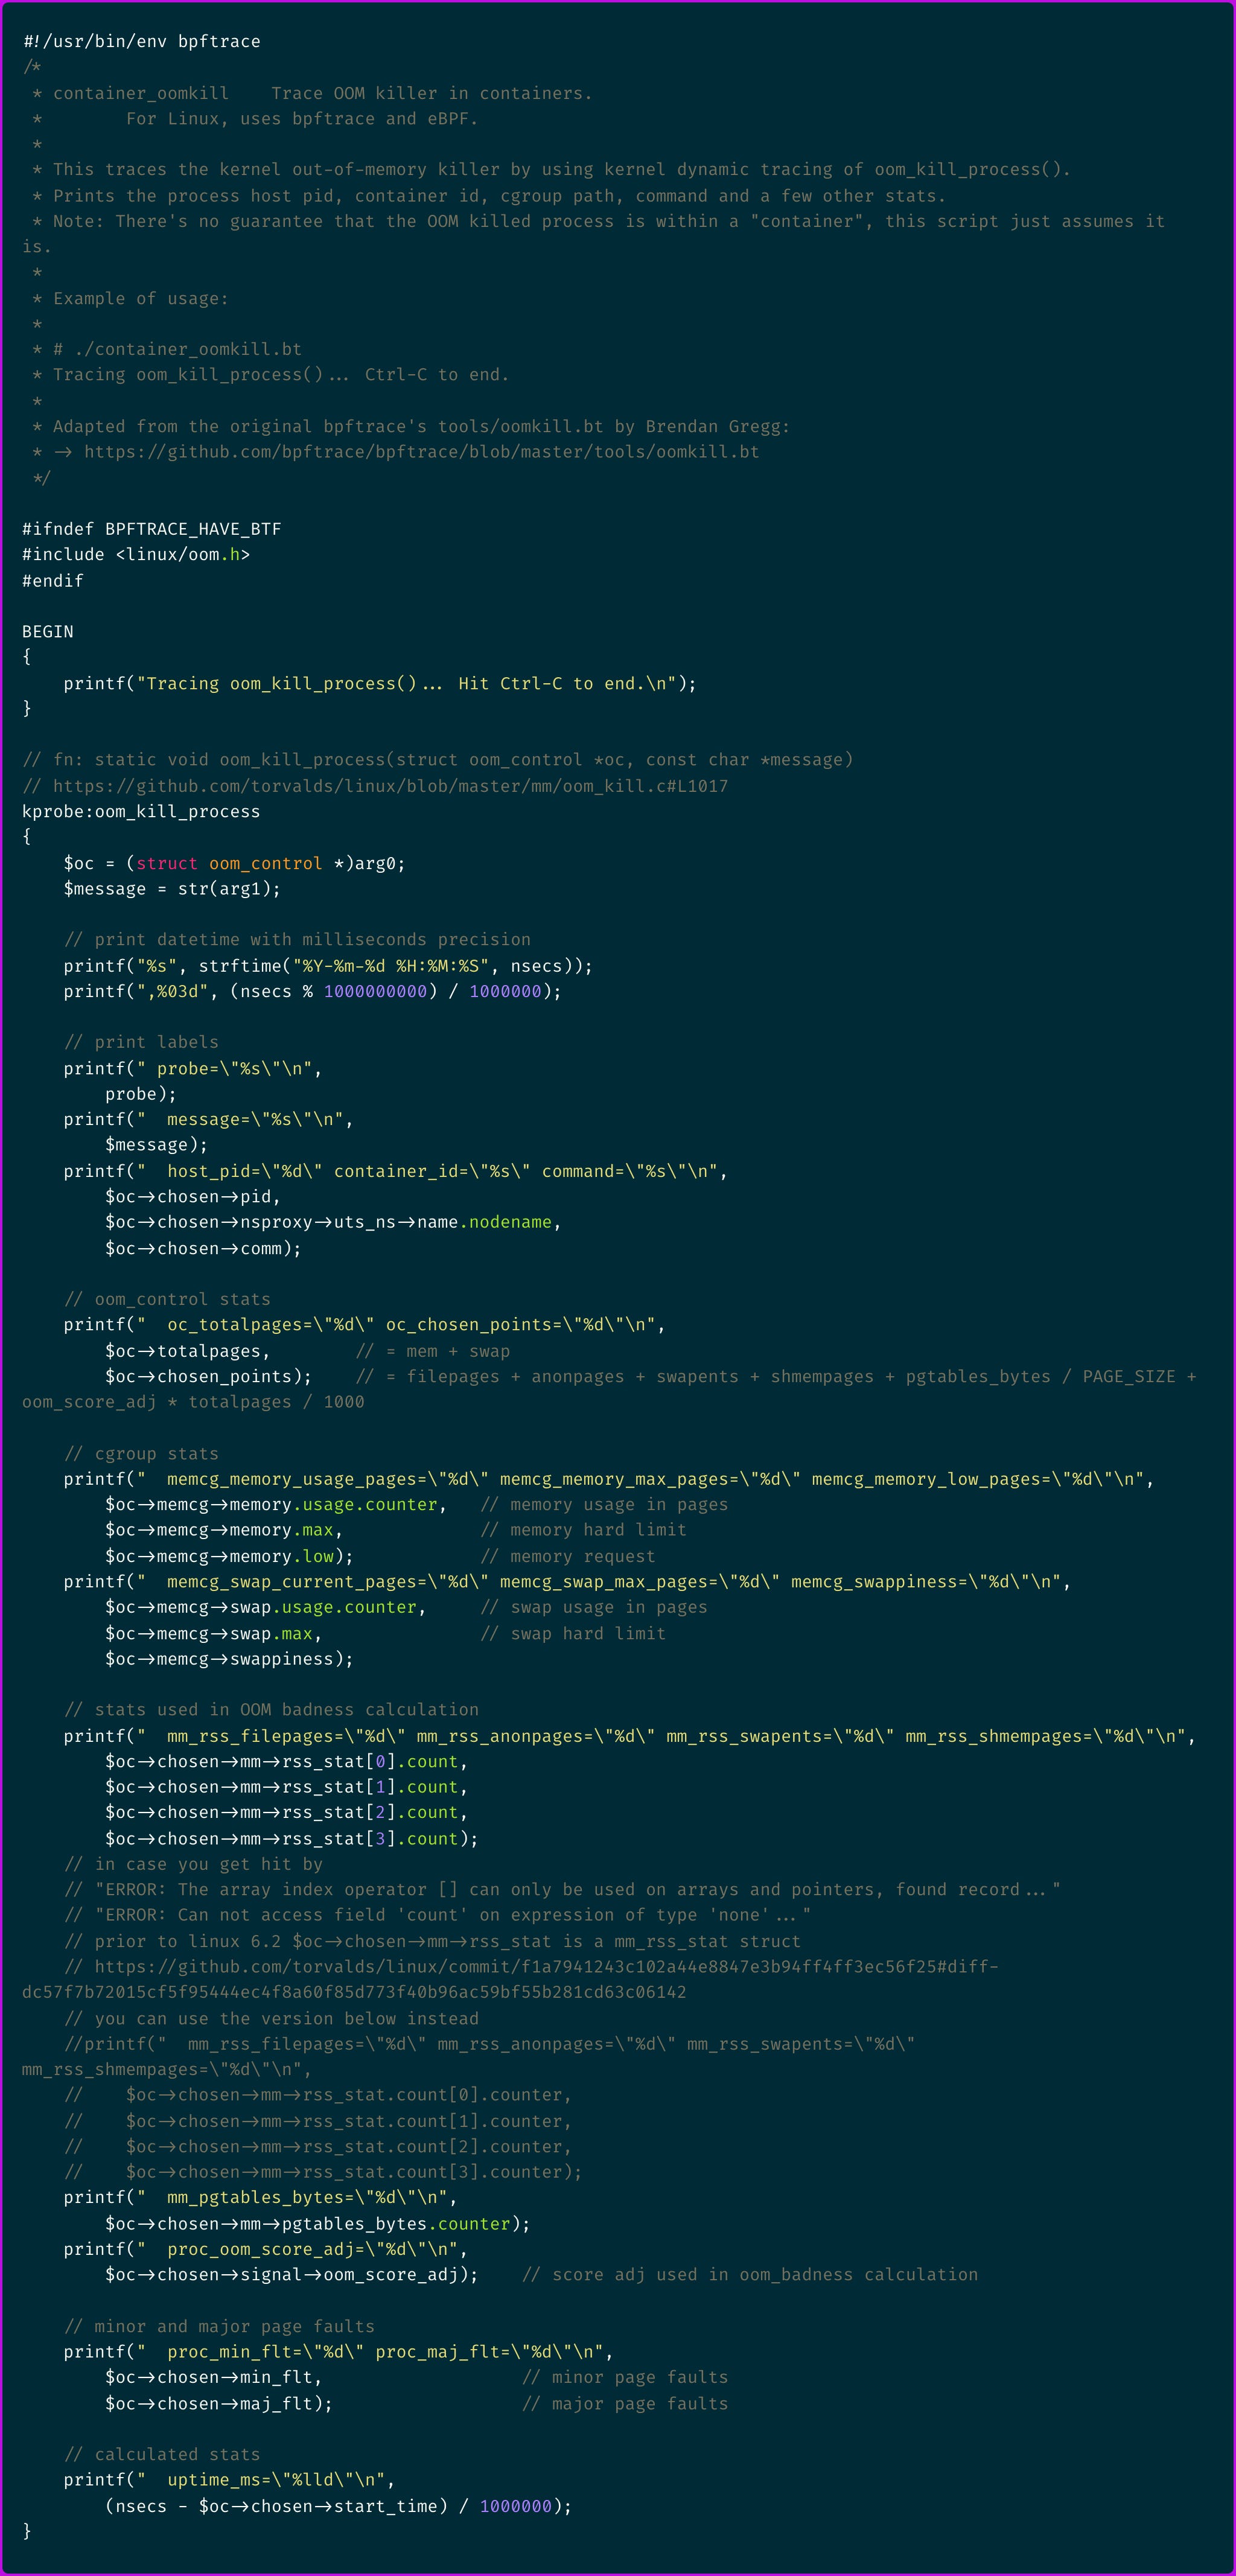
A few noteworthy bits:
$oc->chosen->nsproxy->uts_ns->name.nodenamegets the container id$oc->memcg->memorycontains the cgroup memory usage and limits,$oc->memcg->memory.maxis what you would call in Kubernetes the "resource limit" while$oc->memcg->memory.lowwould be the "resource request"$oc->memcg->swapcontains the cgroup swap usage and limits, which might be relevant as we saw thatswapentsis one of the factors that influences OOM killer's selection$oc->chosen->mm->rss_statcontains the process RSS stats list, ordered as defined in the enum NR_MM_COUNTERS, respectivelyMM_FILEPAGES,MM_ANONPAGES,MM_SWAPENTS,MM_SHMEMPAGES$oc->chosen->signal->oom_score_adjand$oc->chosen->mm->pgtables_bytes.counterare part of the variables we saw being used in the OOM badness calculation so we can display that as well
Running this script we get the following output including the container ID for which the process was killed and some other useful information described above.
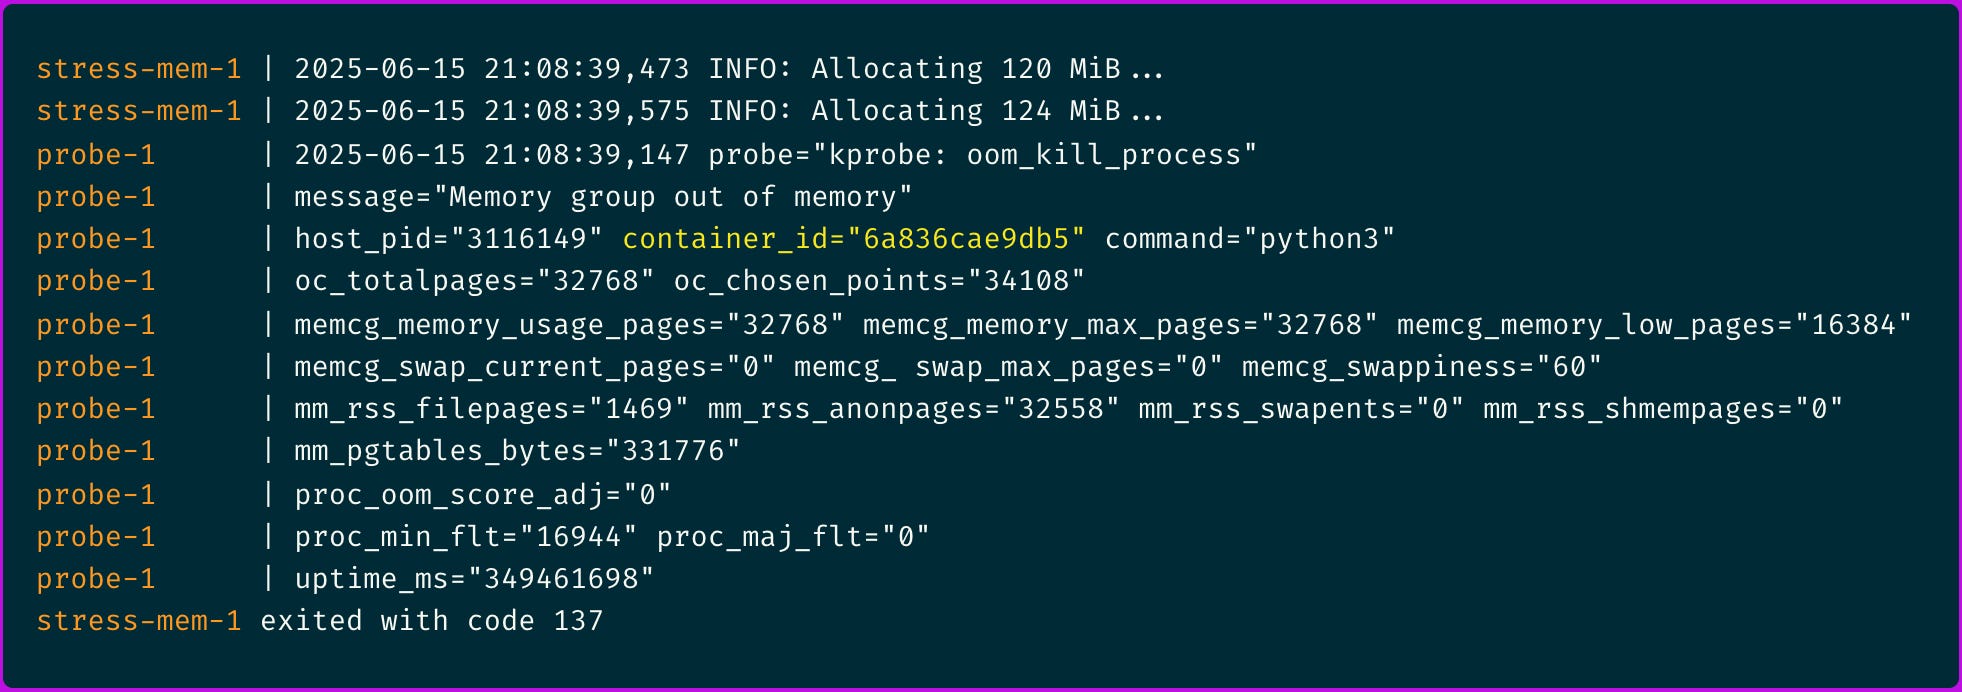
💡 I also had to disable swap space by setting memswap_limit in the docker-compose.yml file to prever stress-mem container to be able to allocate more than 128MiB of memory space.
No major page faults, no swap, the process got OOM killed at 124MiB which is the last increment before it could reach 128MiB. Perfect. Our probe works yay!
Complete code is available in the following GitHub Repository including the docker-compose.yml file that runs the oomkill eBPF probe and the stress-mem container to validate it’s working.
I hope you find this resource helpful. Keep an eye out for more updates and developments in eBPF in next week's newsletter.
Until then, keep 🐝-ing!
Warm regards, Teodor and Arthur