
How Cycode Optimized CI/MON eBPF Agent to Handle Thousands of Events per Second

eBPF has fundamentally changed the way developers think about system-level observability, performance monitoring, and security.
And in this article, we detail our journey in developing and optimizing the Cimon eBPF agent — a tool designed to process thousands of events per second.
The focus will primarily be around the engineering challenges we encountered, particularly in achieving high performance and stability in production CI/CD environments.
🚀 Special thanks to Alex Ilgayev, Head of Security Research at Cycode, for putting together this practical guest post for eBPFChirp!
In cloud-native SaaS applications, scale often means handling massive number of user requests.
In the context of eBPF, “scale” refers to the ability to ingest, process, and analyze vast amounts of low-level system events without compromising system performance or stability.
For example, just consider a simple Dockerfile:
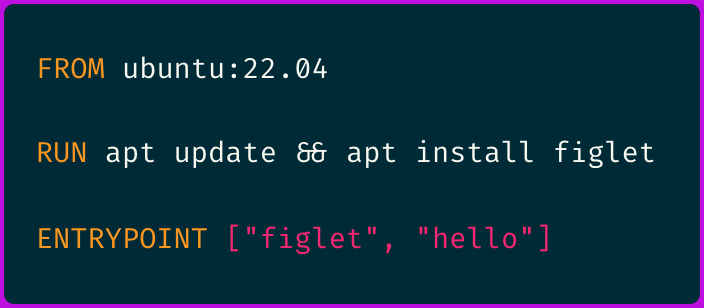
Building the container image using this simple Dockerfile through docker build generates over 4,500 (!) events with filesystem read/write throughput approaching 1 GiB/s.
Now, imagine orchestrating hundreds of such builds concurrently in your CI/CD pipelines. This will require the eBPF agent to be engineered in a way to:
Provide support for as many event types as possible, since the more event types and hooks, the more security context there will be.
Not miss or drop any events as the security applications can’t afford that.
Keep the observer effect to a minimum, introducing only negligible overhead so production workloads remain unaffected.
Below are 7 key lessons we’ve learned on our path to building a high-performance, robust eBPF agent.
1.) Filter Data as Soon as Possible
The best way to handle large volumes of data is to not handle them at all – in other words, filter early. If you can filter unneeded events in the kernel, the user space will have less load to process.
In Cimon eBPF agent, we specifically focus on CI/CD security, so we ignore any events not originating from recognized CI/CD processes.
We detect these through process names like Runner.Worker for GitHub Actions or environment variables when there is no clear convention (e.g., JENKINS_URL for Jenkins).
This keeps background OS processes from unnecessarily entering our output execution report.
The strategy can be applied to other use cases:
Only track filesystem events for certain processes or paths.
Filter network events by cgroup or container ID for container-specific monitoring.
Implement more advanced hierarchical filtering (e.g., process trees, cgroups, etc.).
By filtering in kernel space, we drastically reduce the overhead on user space application receiving these events and the overall observer-effect.
2.) Choose Program Types Wisely
Different eBPF program types have varying performance characteristics.
Selecting the appropriate type for your use case is essential for minimizing latency and overhead.
We already compared the different tracing programs in our previous post.

But in short, here’s a great source of performance test between Kprobes, tracepoints, and raw tracepoints. TL;DR:
Raw tracepoints > tracepoints > fentry > kprobes > uprobes, in terms of performance.
LSM hooks are usually best for security use cases if your kernel supports them (+5.7).
3.) Choose Map Types Wisely
eBPF maps serve as the primary data exchange mechanism between the kernel and user space.
The choice of map type can have a big impact on performance and memory usage.
Lets list a few common patterns.
Transferring Events to User Space
When you need high-throughput event delivery, Ringbuf (BPF_MAP_TYPE_RINGBUF) is ideal.
It offers low latency and supports multiple producer CPUs with a single consumer in user space, preserving the order of written events.
One of the challenges is sizing the ring buffer:
A large buffer reduces dropped events but consumes more memory
A small buffer risks frequent overflows.
Balancing these is critical.
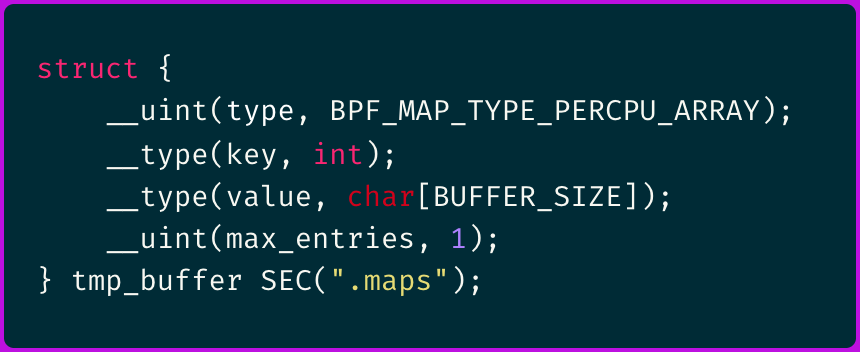
Temporary Buffers
It is common to need temporary buffers for tasks such as traversing data before passing it on.
In such cases, we can utilize BPF_MAP_TYPE_PERCPU_ARRAY with a single entry.
This type of map is designed to be per CPU, meaning the buffer is not shared between CPUs. By defining it as per CPU, we reduce the overhead associated with synchronizing these structures.
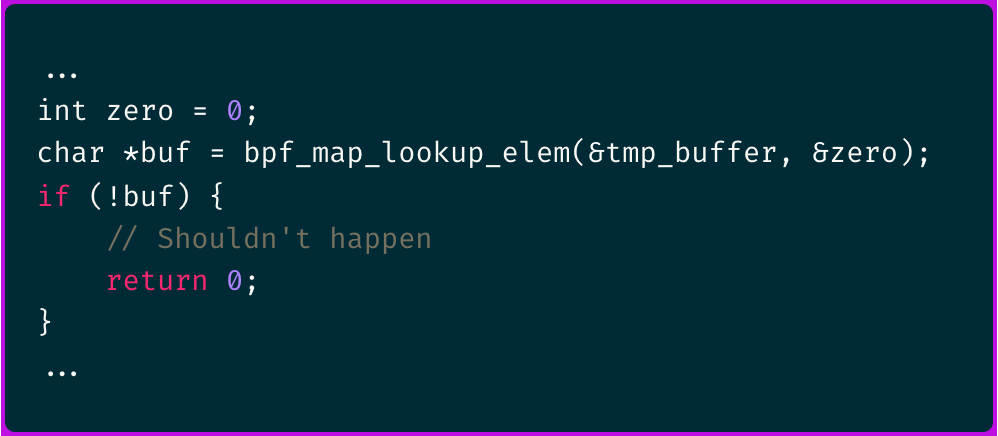
Here is an example of how this map would be defined in code:
And can be accessed in the following way:
Lookup Tables for Hostnames
The best way to construct such a list would be to use a hash map (BPF_MAP_TYPE_HASH), where the hostname serves as the key.
For example:
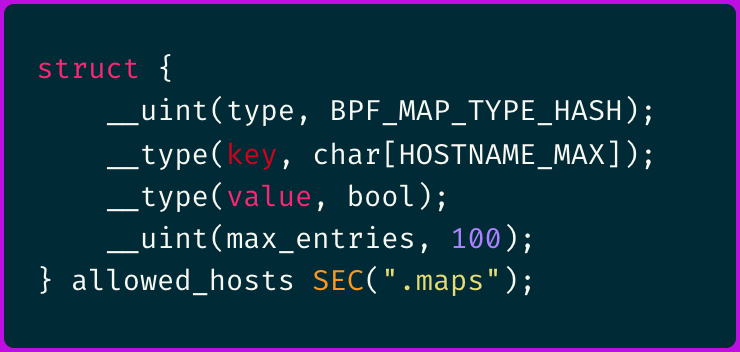
This approach flattens string traversal and comparison, giving insertion and lookup true O(1) performance—only the initial hash computation still scales with the string’s length.
4.) Monitor Your Programs for Performance Anomalies
No matter how optimized your eBPF programs are, you’ll still want to monitor them for anomalies like high CPU usage or dropped events.
In other words — observe the observer.
Program Execution Metrics
One really cool eBPF project for gathering program metrics and monitoring CPU consumption is the open-source bpftop by Netflix.
It leverages the BPF_ENABLE_STATS syscall, which enables global runtime statistics that are disabled by default.
When enabled, each eBPF program reports two key metrics:
total runtime across all executions
number of executions
These metrics allow you to calculate the average execution time, optimize performance, and identify bottlenecks.
However, note that these statistics can impact the overall performance of your eBPF programs, so it is advisable to use them primarily in debugging environment.
If you are using the Cilium eBPF library, you can enable these stats with the following code:
Monitoring Event Drops
Using a ring buffer means there is always a risk of overflow under high load. You can track dropped events directly in your eBPF kernel code:
This information (sent and lost metrics) is eventually retrieved in user mode and published along with the rest of the program metrics information.
Monitor Map Capacity
Whenever there are maps that are constantly updated and are vital to the functionality of the software, their capacity should be monitored.
When working with ring-buffers, we use the following call in our eBPF kernel code to determine the amount of unread data:
This function actually retrieves the number of bytes in the ring buffer that have been written but not yet consumed by the user space application, providing a real-time snapshot of buffer usage.
For other map types, capacity can be assessed by iterating through them in user space.
However, such operations can be costly in terms of performance and should be limited to scenarios like debugging or diagnostic modes to avoid unnecessary overhead.
5.) Do as Much as Possible in the Kernel
Kernel-level processing is inherently faster than delegating work to user space.
Therefore, whenever possible, embed your logic directly within eBPF kernel programs instead of transferring it to the user space. For instance, we can:
Maintain an updated process tree (based on executions and forks) within an eBPF map in order to filter events
Monitor the status of network connections by tracking connections and terminations.
Correlate TCP connections with TLS connections so that TLS events can be enriched with IP and port information.
6.) Manage High Bandwidth Events Efficiently
High event rates can quickly consume memory, potentially leading to system slowdowns or crashes.
For instance, file analysis bandwidth can reach several GB/s, meaning even a minimal per-event memory footprint can cause your program to run out of memory in no time.
Our approach to mitigate this includes:
Record only the information and fields necessary for analysis.
Avoid additional memory allocations or persistent storage for events beyond the initial allocation and promptly free memory once event processing is complete.
Instead of relying solely on the garbage collector to reclaim memory periodically, consider implementing a dedicated memory pool. For example, in Go, using sync.Pool can help manage memory more efficiently and reduce garbage collection overhead.
7.) Consider Event Wakup Strategy
When producing events to a ring buffer, the final parameter in functions like bpf_ringbuf_output and bpf_ringbuf_submit (depending on the method) is __u64 flags.
By default, the flags parameter is set to 0 (BPF_RB_AVAIL_DATA), allowing the kernel to determine when to wake up the user-space process.
While this default setting works well in many scenarios, for very high-throughput scenarios, you might want to:
Avoid Immediate Wakeup — use the
BPF_RB_NO_WAKEUPflag to defer user-space wake-ups, reducing interrupt overhead.Implement Custom Wakeup Logic — for instance, trigger a wakeup only when the ring buffer reaches a certain fill level.
This trade-off requires careful tuning to balance latency against overhead.
And that’s it - you’re ready to perform some high-performance eBPF coding.
I hope you find this resource helpful. Keep an eye out for more updates and developments in eBPF in next week's newsletter.
Until then, keep 🐝-ing!
Warm regards, Teodor and Alex