


Reading Between the Bytes: Inspecting Compiled eBPF with bpftool, readelf & llvm-objdump
From eBPF C Source Code to Kernel-Ready ELF


When you're getting started with eBPF, it can feel a bit like magic. A few lines of code, an eBPF map, a couple of BPF helpers—and suddenly, you're running code inside the kernel.
But what's really happening under the hood?
How are these pieces wired together, and how does your human-readable C code become something the kernel can actually run?
The following sections will teach you how to inspect compiled eBPF .o files using various tools—a skill that's not only useful for debugging, but also for building a clearer mental model of how your eBPF programs go from source code to kernel execution.
🚀 Special thanks to Giuseppe Ognibene, Software Engineer at Rakuten Mobile, for putting together this deep and practical guest post for eBPFChirp!
Whenever an eBPF program is compiled, it becomes an ELF (Executable and Linkable Format) object file (.o).
While clang is the go-to compiler for producing these .o files, many cloud-native tools written in Go rely on bpf2go.
This tool not only compiles your C-based eBPF code but also generates Go bindings, making it easy to load and interact with your eBPF kernel space programs from Golang user space program.
But what’s often overlooked is that bpf2go isn’t a compiler on its own—it simply wraps clang (and tools like llvm-strip) under the hood.
In other words, it's a convenient wrapper, not an independent toolchain.
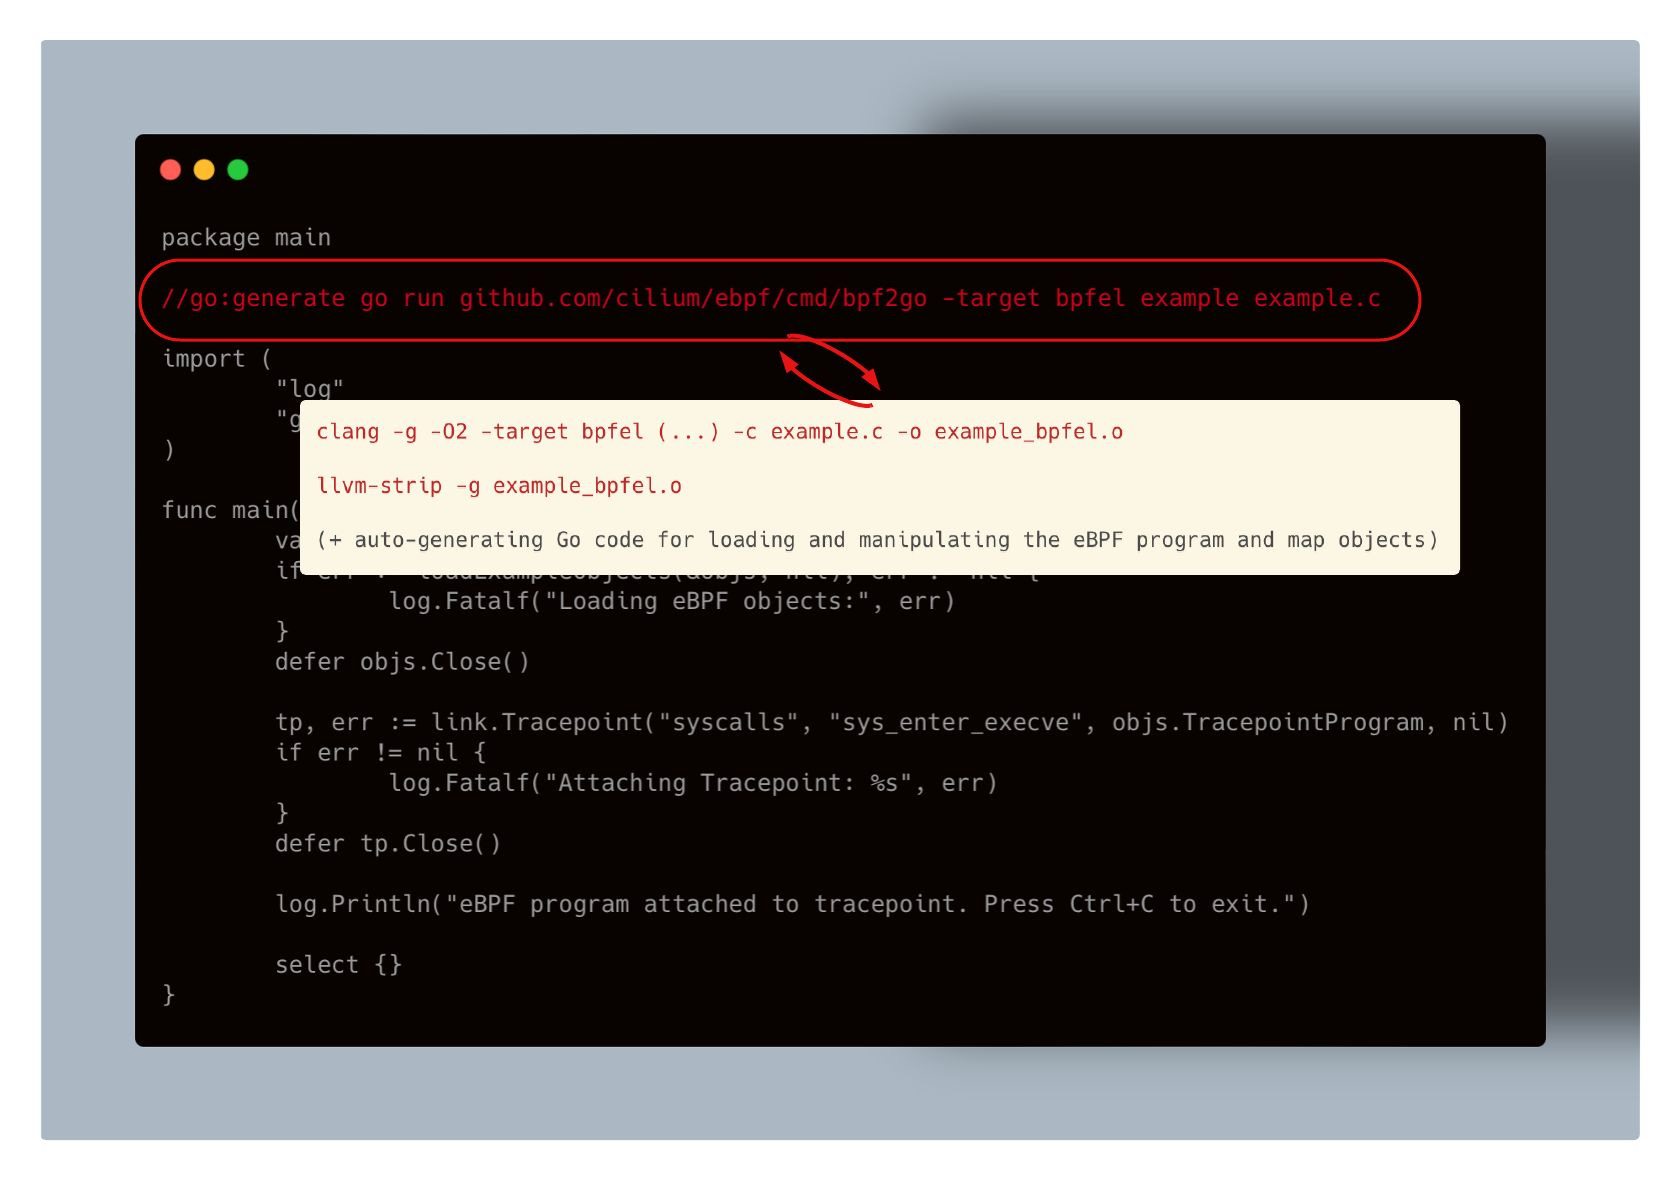
And as seen on the image, the .o files generation is influenced by a specific set of Clang flags:
-O2ensures the code is optimized by simplifying control flow and removing dead code.-genables debug information, which is required to also embed BTF (BPF Type Format) metadata into the output binary. We’ve touched on BTF in earlier posts—if you're curious to dive deeper, check out this one.
-target bpfeltellsclangfor what CPU architecture to compile the eBPF code for.
Actually, if you omit the -target flag, the compiled eBPF code will follow the endianness of the CPU architecture it’s compiled on.
This means that if you're compiling on a little-endian CPU, the program's byte order will be little-endian; if you're compiling on a big-endian CPU, it will be big-endian.
Interestingly, the Clang compiler also supports target options like amd64 or arm64 for cross-compilation, allowing you to compile on one architecture and run on another.
That said, you have a couple of options for setting the -target flag when compiling the program using clang:
bpf: Uses the endianness of the CPU it compiles onbpfel: Compiles for little-endian systems (x86, ARM, RISC-V, …bpfeb: Compiles for big-endian systems (IBM System/360, 370, 390, Z, ..)*architecture specific: Be it either
amd64,arm64and so on
Though architecture specific compilation might rarely be of your concern, it becomes important for cases like eBPF kprobes since they rely on the kernel's struct pt_regs input context, which stores a copy of the CPU registers' contents.
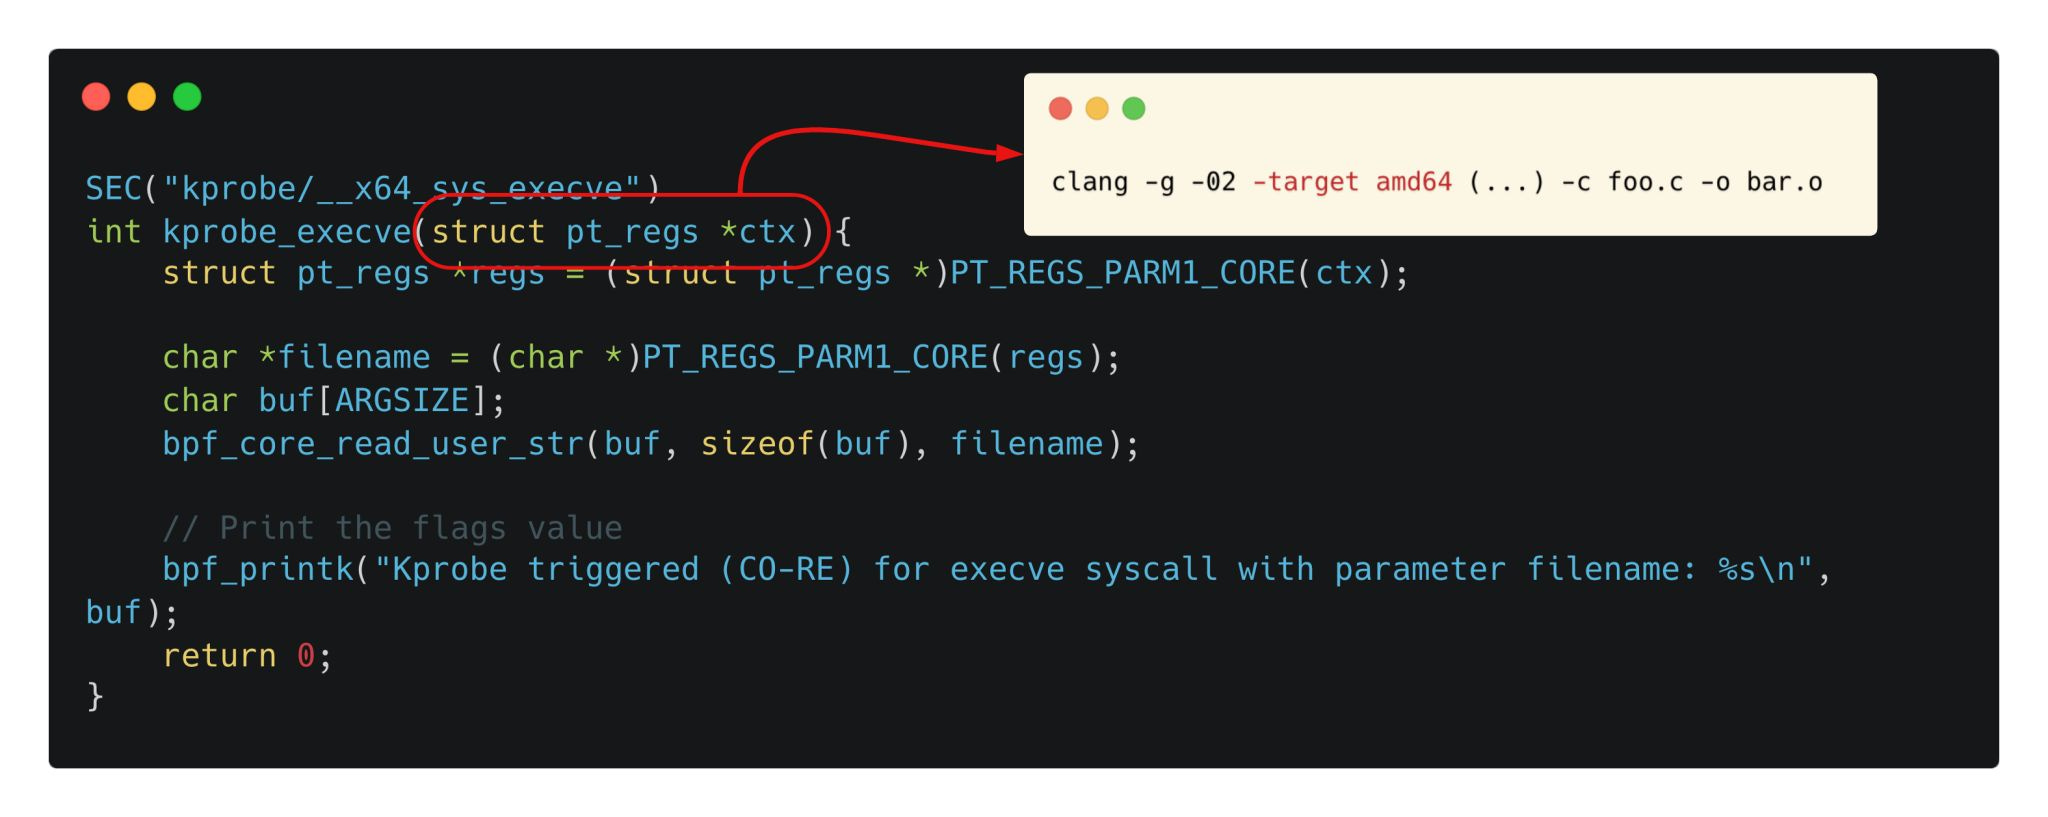
And since CPU registers are “architecture-specific”, the pt_regs structure definition depends on the architecture you’re running on, requiring you to specify the appropriate -target flag.
But what about
llvm-stripthatbpf2goutilizes besideclang?
Well, when deploying eBPF programs to production, we typically want them as small and lean as possible.
While debug symbols are useful during development, they can be safely removed before deployment—and that’s exactly what llvm-strip does.
If you want to retain the debugging information for inspection, you can pass the -no-strip flag to either bpf2go or clang (since, as we've seen, they ultimately use the same underlying toolchain).
It’s good to keep this in mind, because stripping affects the output of tools like readelf and llvm-objdump, which we’ll be using shortly.
That said, in this post we’ll work with the stripped version i.e. ”the default one”.
Tools and How to Use Them
To inspect and explore an eBPF .o file, we’ll use bpftool, readelf, and llvm-objdump.
We'll apply them on a simple eBPF code example—an XDP program that counts IPv4 packets.
In short, the program:
Verifies the packet is Ethernet, IPv4, and not malformed.
Increments a counter for each IPv4 packet and stores the value in eBPF map.
A user space program reads the value from the eBPF map and prints it to the command line.
The mentioned repository contains numerous other examples, each with build and run instructions provided in the accompanying documentation.
Using bpftool (Recommended Approach)
bpftool allows for inspection and simple modification of eBPF objects on the system.
We can use it to do many useful things, such as inspect loaded eBPF programs, eBPF Map contents, BTF information, and even pin or detach programs from the kernel.
For our example, we can list running eBPF programs:

Then there’s bpftool dump xlated command that displays content of eBPF registers as the eBPF code would execute.

For more information about eBPF register, it might be worth reading the BPF and XDP Reference Guide from Cilium but in short the program operate using 10 registers:
Register
r10is the only register which is read-only and contains the frame pointer address in order to access the BPF stack space.The remaining
r0 - r9registers are general purpose and of read/write nature:r0contains the return value of a helper function call.r1 - r5hold arguments from the eBPF program to the kernel helper function.r6 - r9are callee saved registers that will be preserved on helper function call.
We can also list and inspect eBPF Maps:

But why are there three eBPF maps when our example code only initializes a single map called counter?
What are then .bss and .rodata eBPF Maps?
Well, as stated in the eBPF docs:
In eBPF we have no heap, only the stack and pointers into kernel space. To work around the issue, we use array maps. The compiler will place global data into the
.data,.rodata, and.bssELF sections. The loader will take these sections and turn them into array maps with a single key (max_entries set to 1) and its value the same size as the binary blob in the ELF section.
Let’s inspect them one by one to understand this better.
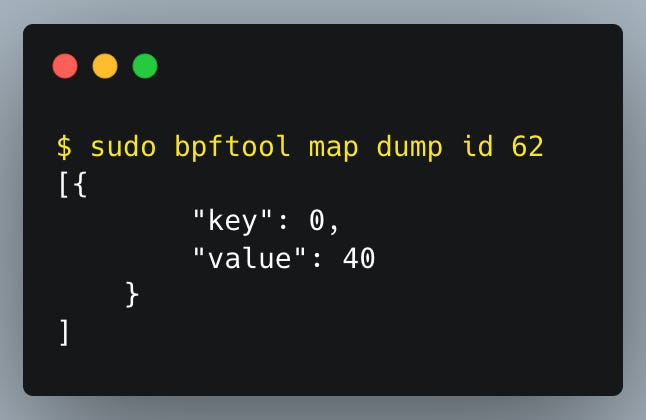
The counter eBPF Map of type BPF_MAP_TYPE_ARRAY, has a single element with key = 0 and value = 40. This means that the eBPF program has analyzed 40 IPv4 packets.
Then there’s the .bss eBPF map that represents the .bss section of the eBPF program’s data and it contains global variables from the eBPF code.

And the variable global_counter has a value 40, since we increment it in sync with the map counter value.
And finally, as for the .rodata eBPF map, it represents the .rodata section, which holds read-only data, often including format strings used in bpf_printk.
In our example, it’s value is “global_counter value %u\n\0” in ASCII format.

bpftool can be used for many other purposes but the following commands already show how handy it is.
Using readelf
readelf is a command-line tool for inspecting ELF files—it lets you peek into section headers, symbols, and relocation entries, which makes it especially useful for debugging compiled eBPF object files.
Just consider the readelf -s bpf_bpfel.o that shows the symbol table, which includes function names and other symbols defined in the object file.

If you are confused what program we are inspecting — it’s the
bpf_bpfel.ofile, generated during the compilation of our example eBPF program.
The columns in the output are:
Num: Symbol index in the symbol table.Value: Address or offset of the symbol.Size: Size of the symbol in bytes.Type: Type of the symbolFUNC: Function symbol. Entry point of the eBPF programOBJECT: Data object live variable, constant, map, etc..NOTYPE: No specific type. Often are internal compiler labels. (I need to go deeper here)SECTION: It is used to mark the presence of a section like .rodata, .text, etc.. There is no actual data or code, indeed the Size is 0.
Bind: Binding type of the symbol:LOCAL: Symbol is local to the object file.GLOBAL: Symbol is visible to other object files (can be used across modules).
Vis: Visibility (usually DEFAULT for symbols visible to all parts of the program).Ndx: Index of the section in which the symbol is located.Name: Name of the symbol.
To fully understand the previous output and the comments in yellow we need to take a look the readelf -S bpf_bpfel.o output, that lists all ELF sections, including .text (for code), .maps, .license, and others.

The colums in the outputs are:
Name: Name of the sectionType: Type of the sectionPROGBITS: Holds actual program or data content (like bytecode or variables).REL: Relocation section that contains information to adjust addresses or references.STRTAB: String table that holds strings used in other sections.SYMTAB: Symbol table containing information about program symbols (functions, variables).NOBITS: Doesn’t have physical data but describes memory regions that will be allocated during execution (e.g., uninitialized variables).LOOS: OS-specific section (in this case, used by LLVM for address signature information).
Address: It is the virtual address where the section would reside when the program will be loaded in the kernel. As we can see is 0 because the address is determined during linking.Offset: It is the offset where the section startsSize: Byte size of the sectionEntSize: Entry size of each item in the sectionFlags:W (write): The section is writable.A (alloc): The section is allocated in memory when loaded.X (execute): The section is executable.S (strings): The section contains string data.I (info): Information for processing.M (merge): The section can be merged with others of the same type.
Link: Section index to which this section is linked, if applicable. For relocation sections (REL), the Link column points to the symbol table (.symtab) that the relocations refer to.Info: Additional info like index into other sections or a ref to a symbol table.Align: Alignment requirement for the section. For example, .text is aligned to 4-byte boundaries, and .maps is aligned to 8-byte boundaries.
While this is all very complex and technical — some things that can be concluded based upon these outputs:
.textis a section that contains program data like the code for the eBPF program..relxdpcontains information to update addresses or offsets within the xdp section or other sections when linking the object file. It hasLink=14(section 14, i.e., the.symtabsymbol table) and it hasInfo=3that means this relocation section contains entries that apply to section number 3, which is the XDP section (i.e., the eBPF code)..bssrepresents uninitialized data (like global variables that are not explicitly initialized). Its size is 8 bytes because we have a global variable__s64 global_counterthat is 8 bytes..mapscontains only metadata describing the maps that need to be created by the eBPF loader. It does not contain the actual contents of the maps at runtime (those live in kernel space after map creation).
And if you looked carefully at the code comments in the readelf -s bpf_bpfel.o output, the size of the .maps section is 32 bytes.
But in our eBPF code example, we defined:

So why is it 32 bytes, when the actual size of the elements is 14 bytes in sum?
Let’s take a look at BTF Style Maps. In particular we can see:

So the eBPF map we have initialized in our program actually translates to:

On a 64-bit system, each field is a pointer, which means → 8 bytes per field and 4 fields x 8 bytes = 32 bytes total.
This is achieved through the BTF Style Maps.
We can verify this by replacing the eBPF map in the code with a Legacy eBPF Map that lacks BTF information — in other words, where the key and value type information is lost:
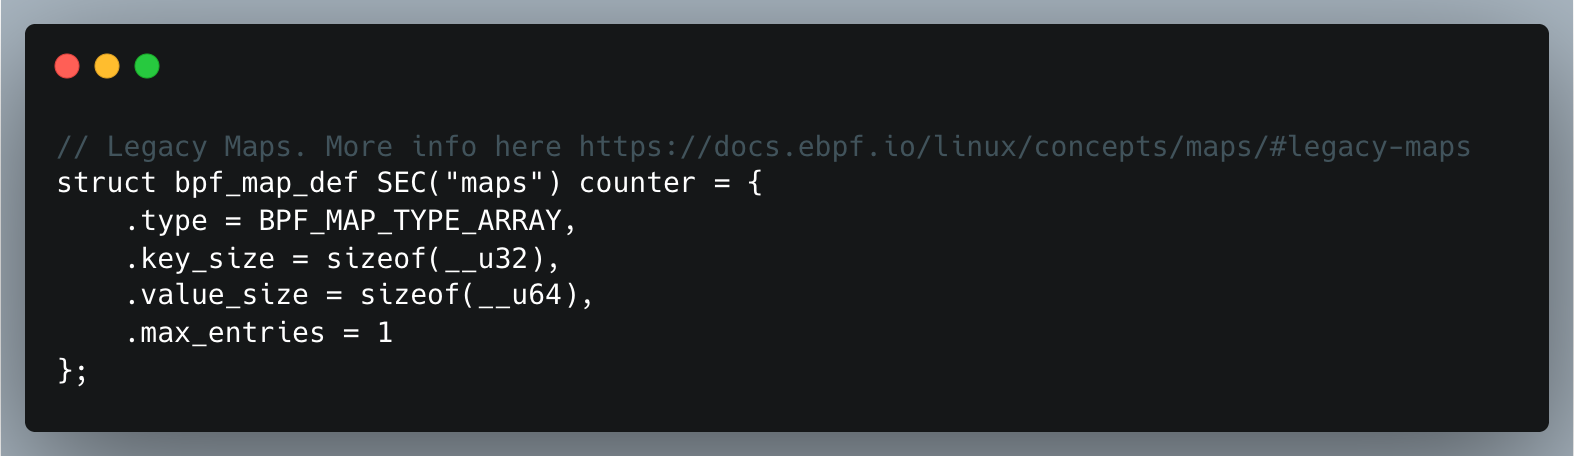
If we recompile the code and inspect it using readelf -s bpf_bpfel.o, we can confirm our assumption:

or using readelf -S bpf_bpfel.o, whose output shows:
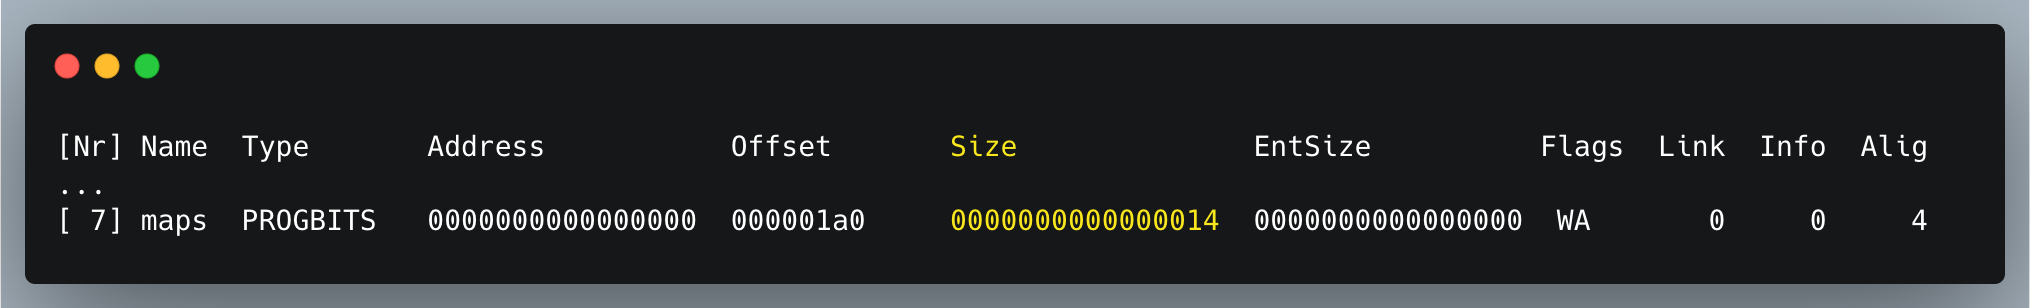
The size is 0x14 in hexadecimal, which is 20 bytes.
Using llvm-objdump
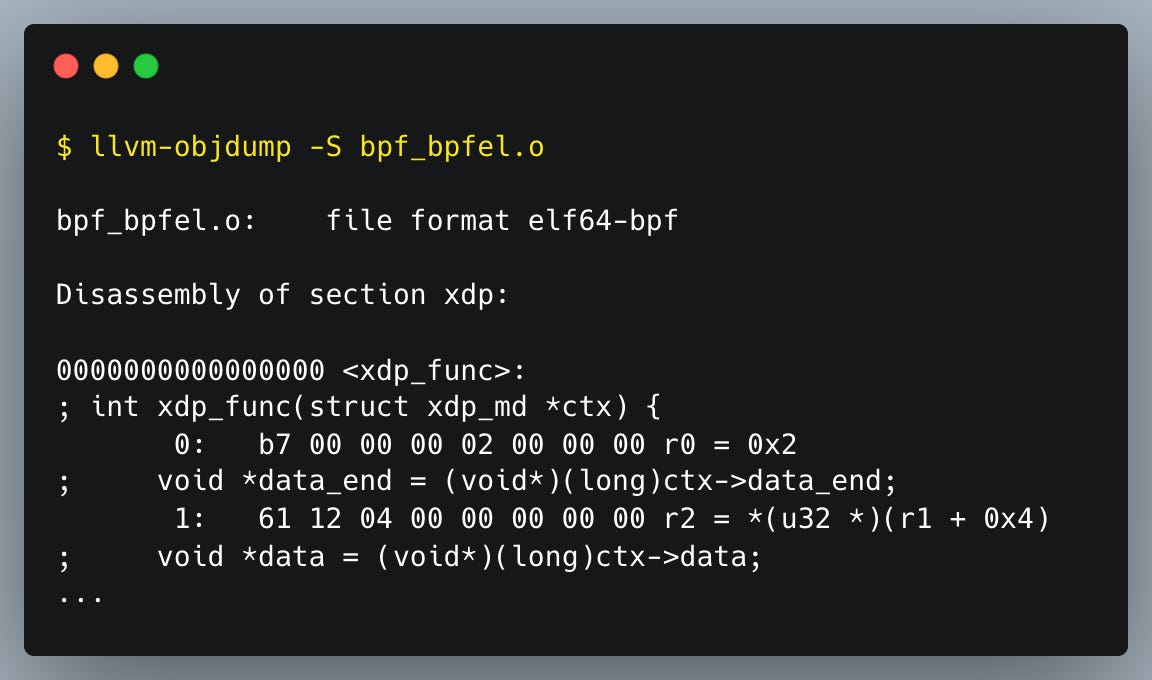
C programmers often utilize objdump to inspect C compiled code, but because it may not support eBPF instructions, llvm-objdump (LLVM’s object file dumper) is usually a better choice.
Below we can see the output of the command llvm-objdump -S bpf_bpfel.o, unlike the output from the command bpftool prog dump xlated, this output works on the .o file itself and not on the program loaded in the kernel.
And that’s it for todays’ newsletter.
⏪ Did you miss the previous issues? I'm sure you wouldn't, but JUST in case:


I hope you find this resource helpful. Keep an eye out for more updates and developments in eBPF in next week's newsletter.
Until then, keep 🐝-ing!
Warm regards, Teodor and Giuseppe
 | A guest post by
|
Amazing read, finally someone simplified how to debug an eBPF programs. Thanks for this blog!